
Masterworks Research · June 2026
When debt and deficits start to dictate monetary policy, the case for owning real assets gets stronger. Here is where art belongs in that conversation, and where it does not.
Fiscal dominance describes a regime in which government debt and deficits grow large enough to constrain what a central bank can do, pushing policy toward inflation or financial repression as the path of least resistance for keeping that debt serviceable [1][2]. The term traces to a 1981 paper by Thomas Sargent and Neil Wallace, "Some Unpleasant Monetarist Arithmetic," which showed that when the fiscal side sets deficits the central bank must accommodate, the central bank can lose control of long-run inflation [3]. For investors, the practical question is simpler than the theory. If the real return on cash and bonds is going to be quietly taxed by inflation or held below it on purpose, what do you own instead? The historical answer has been hard, real assets. We think fine art deserves a seat at that table, with honest caveats about what it can and cannot do.
What You Need to Know
- Fiscal dominance has a precise definition. It is the regime where the fiscal authority sets a path of deficits the central bank must finance, so monetary policy loses its grip on long-run inflation [3]. Sargent and Wallace called this the "unpleasant arithmetic": tightening today can mean more inflation later when the larger debt stock has to be serviced [3].
- The US is closer to the frontier than it was, though not over it. Federal debt held by the public reached roughly 100% of GDP in fiscal 2025, with CBO projecting 118% by 2035 [4][5]. Net interest cost ran about $952 billion in fiscal 2025, near 3.2% of GDP and about 18% of federal revenue, and now exceeds defense spending [4].
- Financial repression is the quieter cousin of inflation. Holding nominal yields below inflation erodes the real value of government debt over time, which transfers purchasing power from savers to the borrower [1][2]. The 1940s through 1950s and the 1970s are the textbook cases.
- Hard assets have a long record under these conditions. Gold rose about 65% in 2025 to record highs, supported by central bank buying that approached 1,037 tonnes in 2024, near the 2022 record [6][7][8]. Real assets broadly tend to outperform nominal claims when real rates turn negative [8].
- Art is one real asset among several, and an imperfect one. Contemporary art has shown near-zero correlation to equities and strong long-run real returns [9][10]. It is also illiquid, produces no cash flow, carries high transaction costs, and is not a monetary instrument [10]. It belongs in this conversation as a diversifier, not as a substitute for gold or Treasuries.
1. What fiscal dominance actually means
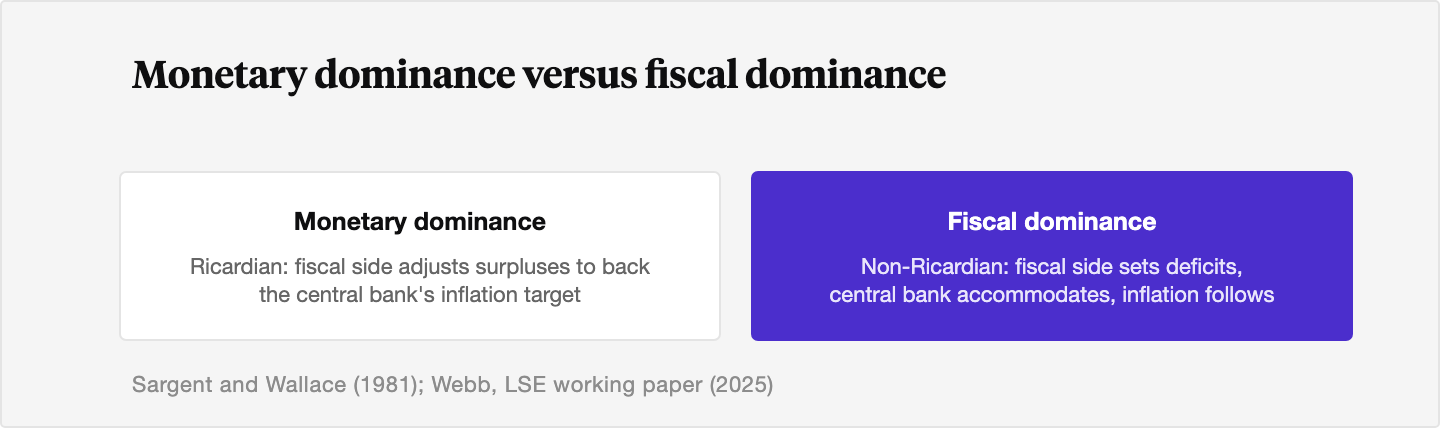
Start with the definition, because the term gets used loosely. In the precise Sargent and Wallace sense, fiscal dominance is a regime in which the fiscal authority commits to a path of primary deficits that is not adjusted to keep the debt sustainable, so the central bank is forced to generate the seigniorage needed to make that debt serviceable [3]. The result is that the central bank loses control of the long-run inflation rate. The opposite regime, the one most developed economies are presumed to operate under, is monetary dominance, where the fiscal side adjusts surpluses to back whatever inflation target the central bank chooses [1][2].
The "unpleasant arithmetic" is the part that makes the 1981 paper famous. Sargent and Wallace showed that in a fiscally dominant regime, tightening money now can produce higher inflation later [3]. The mechanism is plain once you see it. Higher interest rates raise the cost of servicing a large debt stock. If the deficit path is fixed, that larger interest bill eventually has to be financed, and at some point the only remaining tool is money creation. So the disinflation today loads more inflation into the future. A 2021 St. Louis Fed review revisited the paper precisely to ask whether advanced economies were drifting toward this regime, and concluded that long-run inflation control depends on fiscal support that cannot be assumed indefinitely [3].
The point for an investor is not whether the US has crossed some bright line. It is that the conditions that move a country toward that frontier, high debt, a persistent gap between real interest rates and growth, and political resistance to consolidation, are present now [2][4]. When those conditions hold, the menu of ways out narrows to growth, default, inflation, or repression. The first is hard to engineer. The second is unthinkable for a reserve currency. That leaves the last two.
2. The current US debt and interest-cost picture
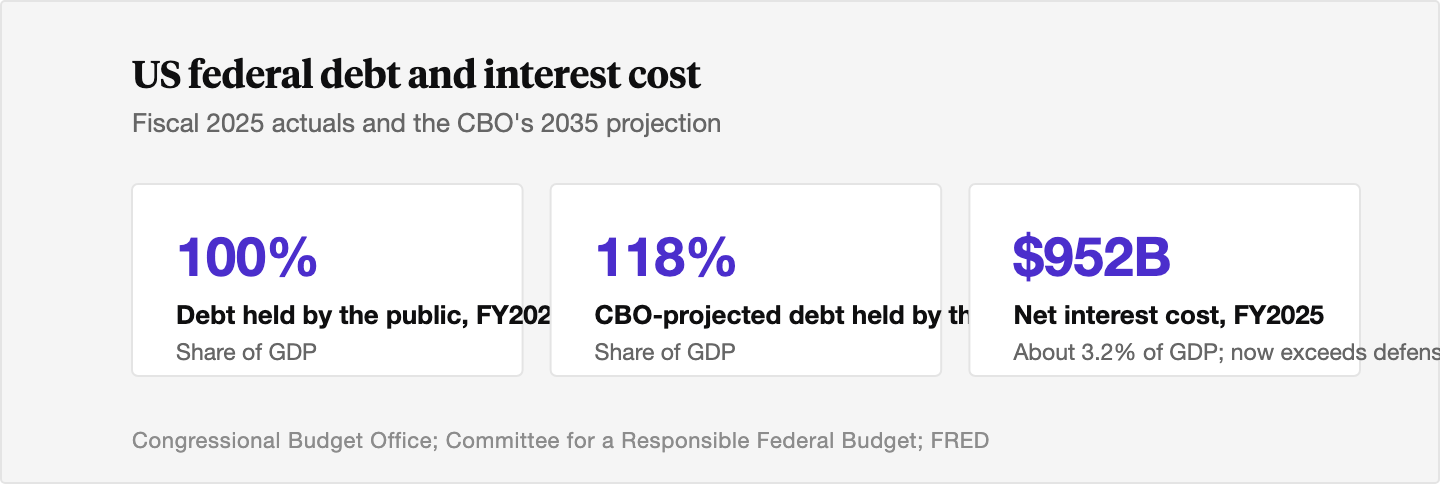
We want to be precise here, and non-partisan. The numbers are the numbers regardless of who is in office. Federal debt held by the public reached roughly 100% of GDP in fiscal 2025, and the Congressional Budget Office projects it rising to about 118% by 2035, with gross federal debt moving from about 123% to 135% of GDP over the same window [4][5]. Quarterly FRED data put debt held by the public near 98% of GDP in the fourth quarter of 2025, consistent with the CBO fiscal-year framing [5].
The interest line is the one that has changed the character of the budget. CBO's baseline implies net interest cost of about $952 billion in fiscal 2025, roughly 3.2% of GDP and about 18% of every dollar of federal revenue [4]. That figure now exceeds what the government spends on national defense [4]. This is the channel Sargent and Wallace flagged. When the interest bill becomes one of the fastest-growing parts of spending, the cost of raising rates to fight inflation rises with it, and the temptation to let inflation or repression do some of the work grows.
None of this is a forecast of crisis. Markets still price US Treasuries as the global risk-free asset, and long-run inflation expectations remain near the Fed's 2% target [3]. The honest read, which the IMF and BIS have both signaled in recent surveillance, is that the US sits closer to the fiscal-dominance frontier than it did before the pandemic, and that preserving monetary independence depends on a credible medium-term path that does not yet exist [1][3]. We are describing a probability that has risen, not an outcome that has arrived.
3. Why financial repression raises demand for hard assets
Inflation is the loud way a government reduces the real value of its debt. Financial repression is the quiet way. The term describes a policy mix, caps on nominal yields, regulatory pressure on banks and insurers to hold government bonds, and real rates held below inflation, that lowers the real cost of funding public debt by transferring purchasing power from savers to the borrower [1][2]. The investor experiences it as a slow, compounding tax on anything denominated in the currency.
The historical record under these conditions is consistent. After World War II, the US carried federal debt above 100% of GDP and ran a decade of capped yields and frequently negative real interest rates, and holders of long-term government bonds earned negative real returns while real assets held their ground [8]. In the 1970s, once the gold window closed and inflation outran nominal yields, gold rose from $35 an ounce in 1971 to around $850 by January 1980, and broad commodities and real estate delivered strong real gains while nominal bonds lost purchasing power [8]. The pattern is the same across both episodes. When the real return on cash and bonds is compressed or negative, capital rotates toward claims on real things that cannot be printed [8].
This is why the demand for hard assets is mechanical rather than ideological. An investor does not need to predict the timing of any inflation. They need only to notice that the real, after-inflation return on the safe parts of a portfolio may be structurally lower than the stated yield, and to want some allocation that is indifferent to that erosion. Gold, real estate, infrastructure, farmland, and at the margin, fine art, all fit that description to varying degrees.
4. How gold and real assets have behaved recently
The current cycle has rhymed with the history. Gold rose about 65% in calendar 2025 to record highs, one of the standout assets of the year, and held near those highs into 2026 despite sharp single-session volatility [6][7]. The official sector has been a structural buyer. Central banks purchased close to 1,037 tonnes of gold in 2024, near the record set in 2022, and continued strong net buying through 2025, much of it driven by emerging-market reserve managers diversifying away from the dollar [7][8].
State Street's 2026 real-assets work frames the driver plainly, that elevated fiscal deficits and rising debt burdens are reinforcing gold's appeal, and Sprott's debt-cycle research makes the same point, that gold tends to outperform when real returns on financial assets are compressed or turn negative [6][8]. Beyond gold, capital has rotated toward real estate and infrastructure sectors with contracted, often inflation-linked cash flows, such as logistics, data centers, regulated utilities, and residential rental [8].
The logic connecting all of this is the substitution from nominal claims on a government balance sheet toward claims on real resources. That is the entire thesis for owning hard assets in a fiscally pressured environment. The question we care about is narrower. Where, if anywhere, does art sit on that spectrum?
5. Where art fits as a scarce real asset
Art belongs in the hard-asset conversation for three reasons, each of which we can quantify. First, it is genuinely scarce, and the scarcity often deepens with time. For an established artist the supply is fixed at the artist's lifetime output, and a portion of that output leaves the market permanently as works enter museum collections. No new Basquiats will be painted. We have said before that there are only about 21 Jackson Pollocks left in private collections. That is a supply curve that bends the opposite way from a printing press.
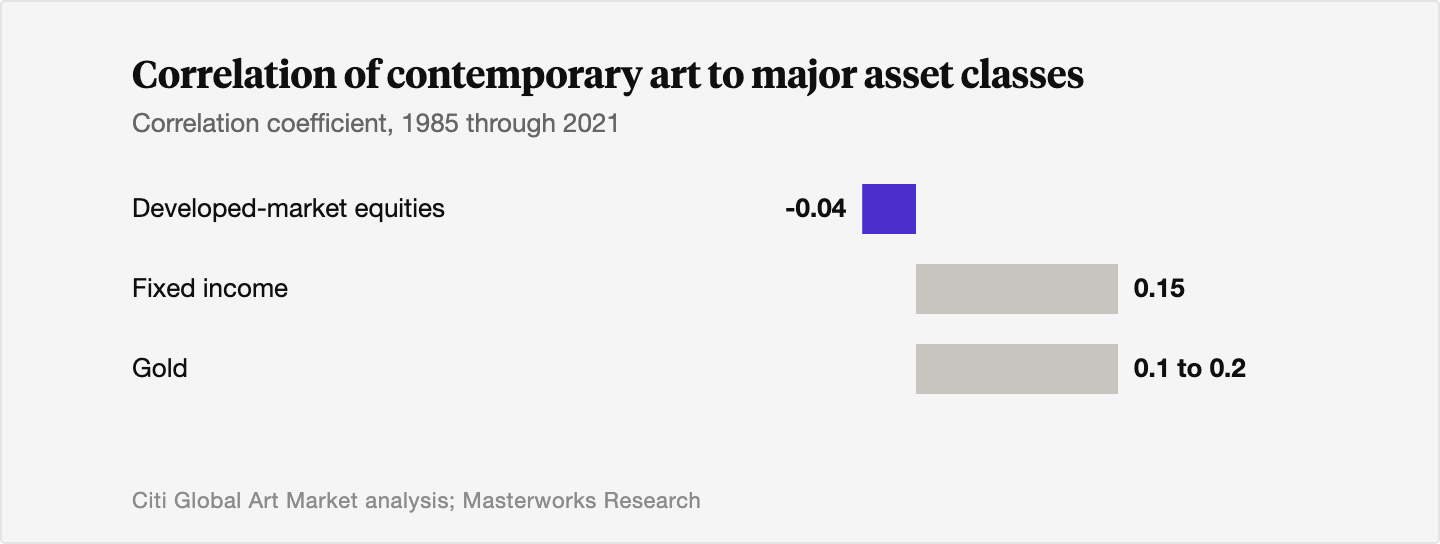
Second, art has shown a near-zero correlation to equities over long periods. Citi's analysis put the correlation of contemporary art to developed-market equities at roughly negative 0.04 from 1985 to 2021, statistically indistinguishable from zero, and its correlation to fixed income at about 0.15 [9]. This is the property that matters most in a fiscal-dominance scenario, because the risk in that scenario is precisely that stocks and bonds get repriced together by the same macro force. An asset that is largely indifferent to that force is doing the real work of diversification. Our own repeat-sale data, built the way Robert Shiller built the Case-Shiller home price index, by tracking the same work across multiple sales rather than averaging a basket of different ones, shows the same near-zero relationship to the S&P 500 [9].
Third, the long-run real return has been positive and the high-inflation track record has been respectable. Across roughly 26 years, contemporary art returned about 13.8% a year by our index, against about 10.2% for the S&P 500, 8.9% for real estate, and 7.2% for gold [9]. In high-inflation windows specifically, our sample shows contemporary art appreciating around 17.5%, ahead of equities and gold in the same periods [9]. Art Basel has separately noted that artworks have tended to preserve purchasing power better than fixed-income instruments, whose nominal cash flows are eroded by inflation [10]. Art also travels. A painting bought in New York can be sold in Hong Kong, which gives it some of the portable, cross-border quality investors prize in a store of value.
We hold these views with conviction and we hedge them honestly. Past performance is not predictive. Index-level returns are not the return on any single work, and the figures above describe the blue-chip segment, not the whole market.
6. The honest limits of art as a hedge
Art is not a monetary instrument, and we will not pretend otherwise. It produces no cash flow. There are no rents, no coupons, no dividends, so every dollar of return depends on selling the work later at a higher price [10]. Classic inflation hedges often work because their cash flows rise with prices. Art has no such mechanism, and its inflation protection is indirect, running through the wealth and willingness of buyers rather than through any contractual link [10].
It is also illiquid and expensive to trade. There is no continuous market for an individual work, time to sale can run months or years, and round-trip transaction costs on a physical painting can exceed 20% once buyer's premium, seller fees, insurance, storage, and appraisal are counted [10]. In a genuine liquidity crisis, art can be one of the last assets a buyer is willing to purchase, which limits its use as a short-term crisis hedge. Gold and Treasuries can be sold in minutes. A painting cannot.
Two more limits deserve naming. Valuation is subjective, inferred from sparse auction comparables and expert appraisal rather than a continuous mark, so reported values carry real uncertainty [10]. And art indices, including repeat-sale indices like ours, are built from works that transact more than once, which biases the sample toward more successful works and tends to overstate the return of a random buy-and-hold across the whole market [10]. We disclose this because it is true and because the credibility of the diversification argument depends on stating it.
So the honest framing is this. Art is one real asset among several. Gold is the purer monetary hedge, with instant liquidity and a reserve role art will never have. Real estate and infrastructure offer the inflation-linked cash flows art lacks. Art's contribution is its near-zero equity correlation and its long-run real return, which make it a useful satellite holding rather than a core position. We think it belongs in the conversation. We do not think it replaces anything already in it.
The Bottom Line
- Fiscal dominance is the regime where debt and deficits constrain monetary policy and push toward inflation or financial repression. The concept comes from Sargent and Wallace's 1981 "unpleasant arithmetic," and the US sits closer to that frontier than it did, with debt held by the public near 100% of GDP and net interest cost above defense spending in fiscal 2025.
- The investor response to that risk is mechanical. When the real return on cash and bonds may be eroded by inflation or held below it, demand rises for hard, real assets that cannot be printed.
- History supports the response. Real assets outperformed nominal claims during the financial repression of the 1940s through 1950s and the inflation of the 1970s, and gold's roughly 65% gain in 2025 amid record central bank buying is the latest example.
- Art has a genuine place in this discussion as a scarce real asset with near-zero correlation to equities and a strong long-run real return, but it is illiquid, yields nothing, costs a great deal to trade, and is not a monetary instrument.
- We treat art as a diversifying satellite allocation of, in our view, a small share of a portfolio, sized alongside gold and other real assets rather than in place of them. Past performance is not predictive of future results.
Sources
- Money, Banking and Financial Markets. "Fiscal Dominance: A Primer." October 25, 2025. https://www.moneyandbanking.com/primers/2025/10/25/fiscal-dominance-a-primer
- Webb, LSE. "Fiscal Dominance in the Modern Era: Revisiting Sargent and Wallace." London School of Economics working paper, September 2025. https://www.lse.ac.uk/finance/assets/documents/faculty-papers/WebbFiscal.pdf
- Federal Reserve Bank of St. Louis. "Is It Time for Some Unpleasant Monetarist Arithmetic?" Review, May 26, 2021. https://www.stlouisfed.org/publications/review/2021/05/26/is-it-time-for-some-unpleasant-monetarist-arithmetic
- Concord Coalition. "Explainer: Sorting Out the Debt Numbers." May 13, 2025. https://www.concordcoalition.org/deep-dives/issue-brief/concord-coalition-explainer-sorting-out-the-debt-numbers/
- Peter G. Peterson Foundation. "How Much Is the National Debt? What Are the Different Measures Used?" February 25, 2025. https://www.pgpf.org/article/how-much-is-the-national-debt-what-are-the-different-measures-used/
- State Street Global Advisors. "Real Assets Insights: Q1 2026." April 21, 2026. https://www.ssga.com/us/en/institutional/insights/real-assets-insights
- iShares (BlackRock). "Investment Directions: 2026 Outlook." January 5, 2026. https://www.ishares.com/us/insights/inside-the-market/2026-market-outlook-investment-directions
- Sprott. "How the Debt Cycle Favors Gold." June 8, 2026. https://sprott.com/insights/how-the-debt-cycle-favors-gold/
- Masterworks. "Is an Investment in Art an Inflation Hedge?" Masterworks Insights, updated February 26, 2026. https://insights.masterworks.com/alternative-investments/art-inflation-hedge/
- Art Basel. "Art Investing in Times of Inflation." November 14, 2023, updated September 10, 2025. https://www.artbasel.com/stories/art-investing-in-times-of-inflation
- CAIA Association. "Real Assets and Inflation Hedging." Portfolio for the Future, April 18, 2025. https://caia.org/blog/2025/04/18/real-assets-inflation-hedging
- in2013dollars.com (BLS CPI data). "$1 in 1913 to 2026 Inflation Calculator." Updated 2026. https://www.in2013dollars.com/us/inflation/1913?amount=1
- Morgan Stanley (Davis Yost Group). "Reviewing Art as an Asset Class and Its Historical and Potential Inflation-Hedging Properties." March 27, 2025. https://advisor.morganstanley.com/the-davis-yost-group/documents/field/d/da/davis-yost-group/Research_Reviewing_Art_as_an_Asset_Class.pdf
- UNC Institute for Private Capital. "Inflation Hedging and Real Assets: Are Public and Private Investments Different?" October 14, 2024. https://uncipc.org/wp-content/uploads/2024/10/Inflation_and_Private_Assets__Paper-Oct-14-2024.pdf
Related Reading
- Art vs Gold as a Hedge Asset: Performance, Correlation, and Trade-offs
- Inflation Hedging: Art vs Gold vs Real Estate vs Crypto
- Art vs Bitcoin: Store-of-Value Narratives, Volatility Profiles, and Correlation Data
- How the $84 Trillion Wealth Transfer Is Changing Art Demand
Disclosures
Investing involves risk. Past results are not indicative of future outcomes.
Masterworks is providing this communication as an agent for its issuer entities, not Masterworks Advisers. This material is produced by Masterworks for informational purposes only and does not constitute investment advice, a recommendation, or an offer or solicitation to buy or sell any security. Masterworks is not a licensed broker-dealer by the SEC or FINRA.
Masterworks can only make and accept sales after an offering statement has been filed, and "qualified", by the SEC. Any offers may be revoked before notice of qualification. Indications of interest involve no obligation. For further disclosure visit the offering documents filed with the SEC and Important Disclosures at masterworks.com/cd.
Forward-looking statements and internal estimates are based on assumptions that may prove incorrect, and actual outcomes may differ materially. Figures denoted in brackets are subject to confirmation. Investing in art and alternative assets involves risk, including loss of principal.
Art sales price data is comparative only. Each painting is unique and historical data is not a direct proxy for any specific painting or investment. Data represents whole art, not an investment into our offerings which includes fees and expenses. Any comparative images are not currently live offerings and are provided for educational purposes only.
Masterworks, LLC is located at 1 World Trade Center, 57th Floor, New York, NY 10007.


