
Masterworks Research · June 2026
How the art market moves through expansion, peak, correction, and recovery, what triggers each turn, and where 2026 sits in the cycle.
The art market moves through the same four phases as most asset markets: a multi-year expansion as wealth and confidence build, a peak when supply of quality work and prices both run hot, a correction when buyers step back and values fall, and a recovery that begins quietly and compounds for years. The difference is timing. Art runs on its own clock, it tends to turn a year or more after equities, and its corrections play out over multiple years rather than weeks. For an investor, the practical question is rarely "is art up or down right now." It is "where are we in the cycle, and what does that say about whether to buy, hold, or sit out." This article walks through the four phases, what triggers the turns, how the art cycle differs from the equity cycle, where the market sat at the start of 2026, and what the historical record does and does not tell you about timing.
A note before we start. Past performance is not predictive. Every figure below is history, and history is a guide to how this market has behaved, not a promise about what it will do next.
What You Need to Know
- Four phases, identified by supply and sentiment as much as price. Expansion, peak, correction, and recovery each show a distinct pattern in volume, in the quality of work coming to auction, and in sentiment. In a correction, prices can look stable on the surface because owners refuse to sell, which masks how soft demand really is.
- Three forces drive the turns. Wealth creation at the very top, liquidity and interest rates, and whether owners bring quality work to market or withhold it. Academic work finds that equity returns help predict art returns but not the reverse.[6]
- The art cycle lags equities and runs longer. Art tends to turn roughly one to three years after stocks, corrections last years rather than weeks because the market is structurally illiquid, and long-run correlation to the S&P 500 sits in a wide band of roughly -0.03 to +0.25.[6]
- History shows two very different correction profiles. The Japanese Impressionist bust of the early 1990s saw prices fall more than 50% and took about 15 years to recover. The 2008 crash cut global sales 40%, but the investment-grade segment recovered fast, with post-war and contemporary evening-sale averages up roughly 373% to 413% over the following nine years.[2][3]
- At the start of 2026 the market sat in the early stage of a recovery. Total sales rose 4% to an estimated $59.6 billion in 2025 after two down years, public auctions rebounded 9%, transaction volume rose, and dealer sentiment improved.[1]
1. The four phases of an art market cycle
An art market cycle has four phases, and you can identify each one by what is happening to volume, to the quality of work coming to auction, and to sentiment, not just to prices.
Expansion. Wealth at the top is rising, confidence is high, and sellers are willing to part with good material because they expect strong prices. Sell-through rates climb, buy-in rates (the share of lots that fail to sell) fall, and prices grind higher. The expansion that ran from roughly 2010 through 2014, and the post-pandemic surge of 2021, are recent examples.
Peak. Supply of trophy works and prices both run hot at the same time. Records get set, guarantees pile up, and the marginal buyer is paying prices that are hard to justify on any fundamental basis. The global market reached an estimated $67.8 billion in 2022, the high after a 31% jump in 2021, before it rolled over.[1][7]
Correction. Buyers step back, the best material gets withheld rather than sold into weakness, auction totals fall, and prices for recent purchases come under pressure. Corrections in art are slow. They tend to run for two to three years, not two to three months.
Recovery. Volume returns first, then quality comes back to the salesroom, then prices follow. Recoveries start quietly and, historically, have compounded for years once they take hold. We will get to the precedents.
The tell that separates these phases is usually supply and sentiment, not the price line alone. In a correction, prices can look stable on the surface precisely because owners refuse to sell, which masks how soft demand really is.
2. What triggers the turns between phases
Three forces move the art market between phases: wealth creation at the very top, liquidity and financing conditions, and the supply of quality work that owners choose to bring to market.
We tend to think about art demand as a call option on the top 1%, really the top 0.01%. A good collection runs somewhere between $50 million and $100 million, so the people who set prices at the high end are billionaires and centimillionaires. When financial assets are booming and entrepreneurial wealth is being created, that buyer base bids aggressively. When paper wealth falls, the bidding thins out at the top first. Academic work confirms the mechanism: studies find that stock market returns Granger-cause art returns, but not the other way around, which is the technical way of saying art reacts to equity-driven wealth rather than leading it.[6]
Liquidity is the second lever. Higher interest rates raise the cost of carrying an illiquid asset and make borrowing more expensive, and tighter credit reduces the financing dealers and collectors use to hold inventory. The Fed's hiking cycle that began in 2022 maps almost exactly onto the art correction that followed. When money is cheap, speculative demand shows up at the margin. When it is expensive, that demand disappears first.
Supply is the third, and it is the one most investors underweight. In a downturn, owners of expensive works simply stop selling. They hold their Warhols and their Monets until the market turns favorable again.[5] That withholding props up headline prices for established names, but it also drains the salesroom of the trophy lots that drive aggregate totals. A recovery becomes visible when sellers regain enough confidence to bring great material back. Quality returning to auction is one of the clearest signals that the cycle has turned.
3. The 1989 to 1991 Japanese bubble: what a peak looks like
The clearest example of a peak and a violent correction is the Japanese-driven Impressionist bubble of the late 1980s. By 1990, Japanese buyers were taking an estimated 40% to 50% of all Impressionist works on the market and importing roughly $5 billion of art in a single year.[2] In May 1990, the businessman Ryoei Saito bought Van Gogh's "Portrait of Dr. Gachet" for $82.5 million and Renoir's "Bal du moulin de la Galette" for $78.1 million, both records at the time.[2]
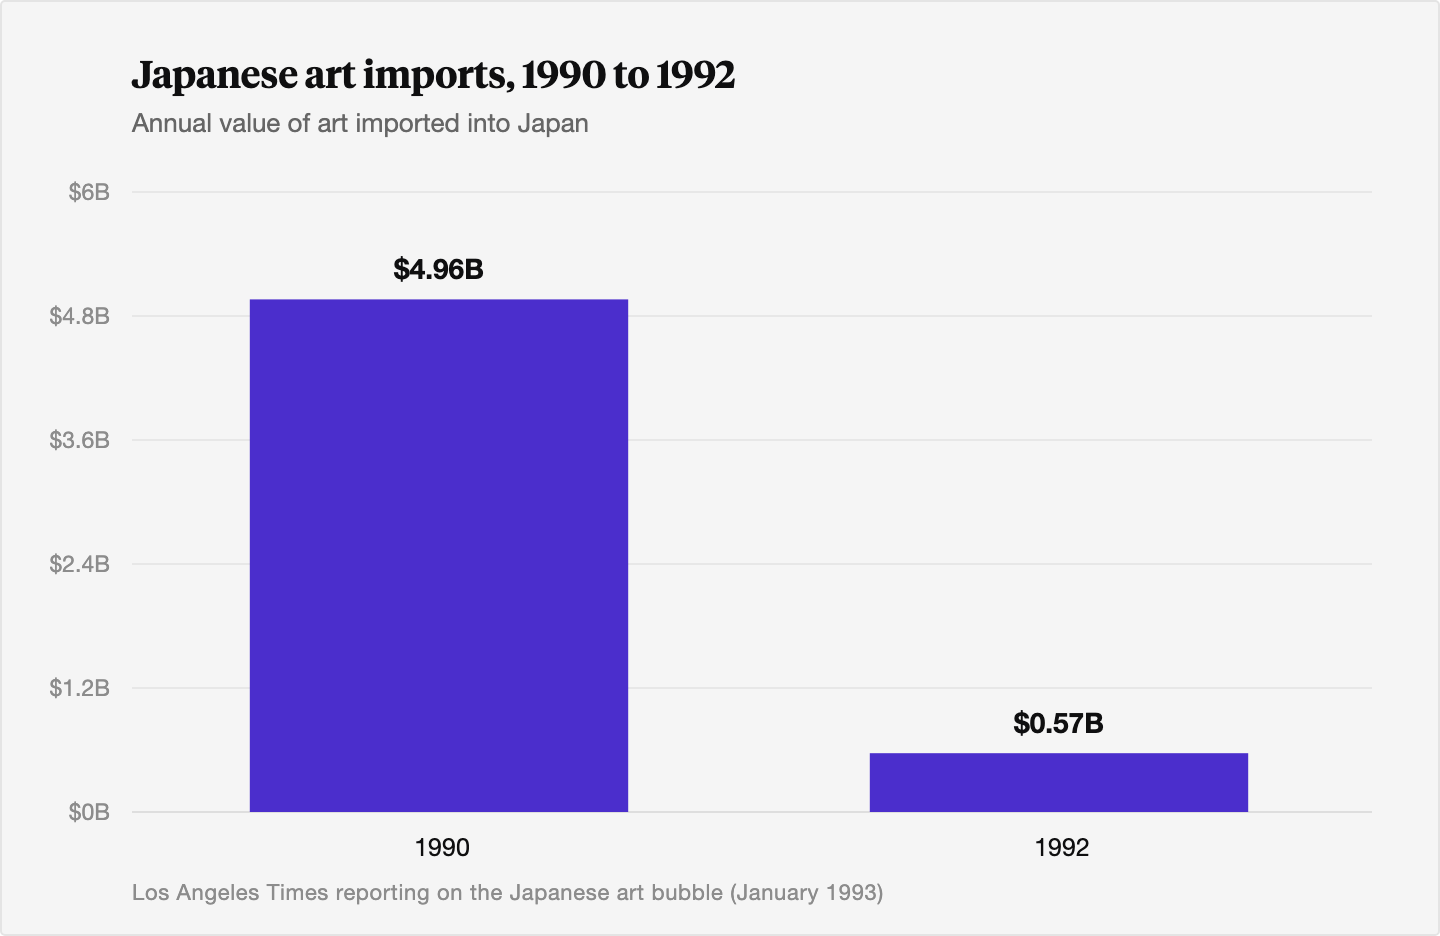
Then Japan's asset bubble burst. The Nikkei peaked at the end of 1989 and had roughly halved by August 1990 after the Bank of Japan raised rates. Japanese art imports collapsed from $4.96 billion in 1990 to $0.57 billion in 1992, a decline of 88.5%.[2] By 1993, Impressionist art prices were down more than 50% from their peak.[2] Recovery took roughly 15 years. Aggregate Impressionist sale totals did not consistently challenge their late-1980s nominal highs until the mid-2000s, and in real terms the wait was longer still.[2]
The lesson is about concentration. The 1980s bubble was driven by one marginal buyer, Japanese capital, in one segment, Impressionism. When that buyer left, there was nobody to catch the falling prices, and the recovery was slow because capital and attention rotated toward post-war and contemporary art instead. A peak built on a single source of demand is the most fragile kind. The same pattern shows up wherever a new pool of national wealth floods the market quickly, a dynamic we trace in <a href="/academy/posts/art-in-emerging-market-booms-lessons-from-china-2005-2015-and-russia-2000-2008">art in emerging market booms, lessons from China 2005 to 2015 and Russia 2000 to 2008</a>.
4. The 2008 crash: what a fast correction and recovery look like
The 2008 to 2009 drawdown was sharper than the Japanese bust but recovered far faster. Global art and antiques sales fell from $62 billion in 2008 to $30.5 billion in 2009, a 40% decline from the 2007 high, and one of the steepest since the early 1990s.[3] At the top end, auction volume dropped on the order of 60% to 80% in 2009 as expensive works simply stopped trading.[3] On a repeat-sale basis, the Sotheby's Mei Moses All Art index fell about 27% from 2007 into 2009.[8] Global auction sales fell from $32.9 billion in 2007 to $18.3 billion in 2009.[5]
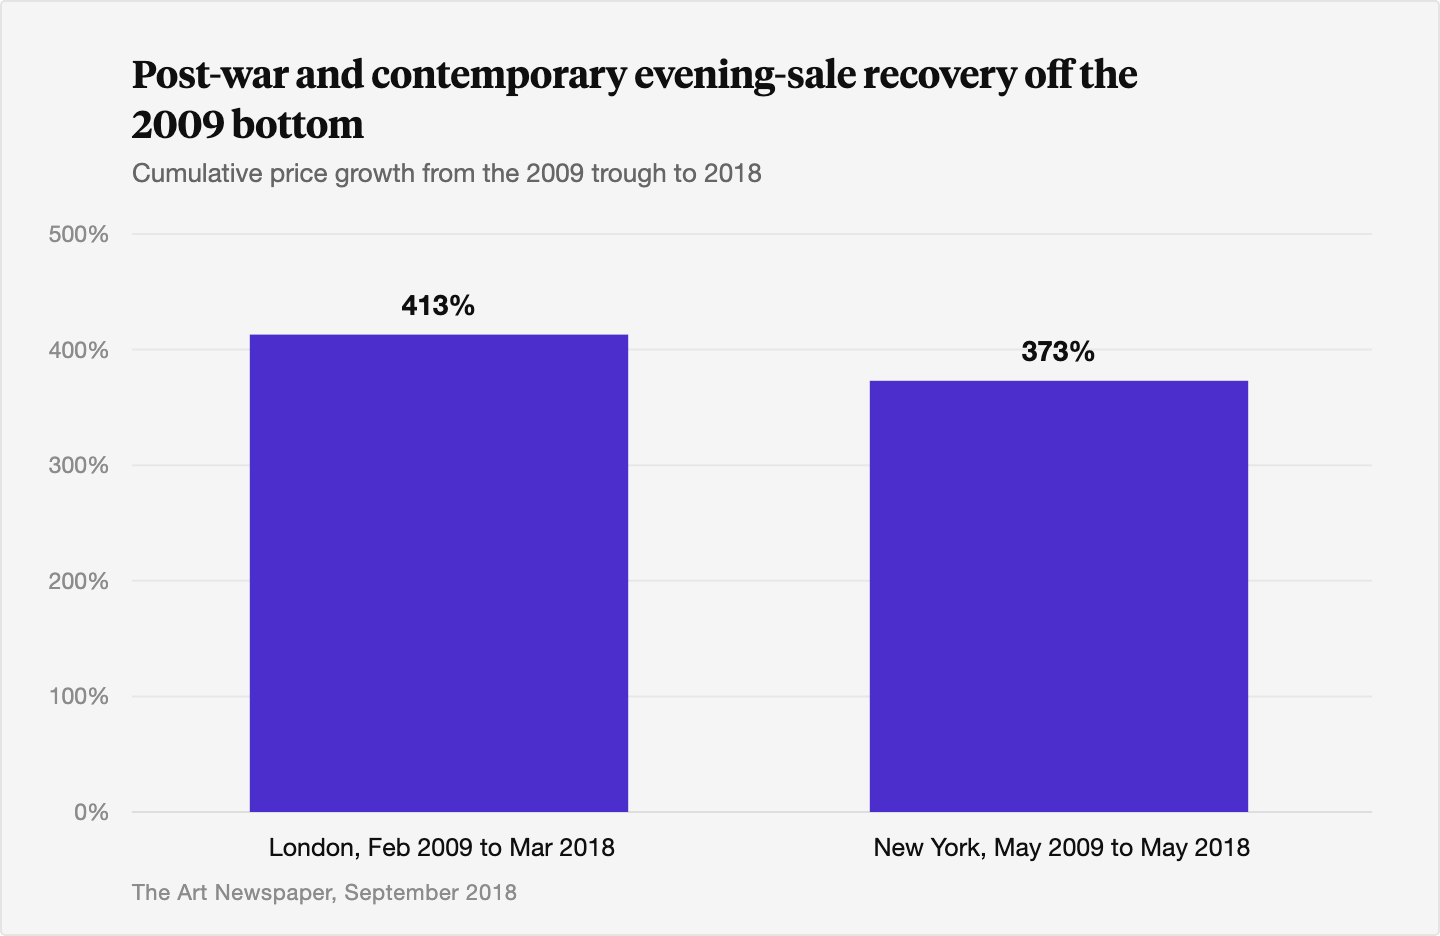
The market bottomed in 2009 and bounced back in 2010, helped by the emerging Chinese market, and global auction sales were back above $30 billion by 2011.[3][5] What happened next is the part most investors miss. Average prices for post-war and contemporary works sold at evening auction rose roughly 413% in London between February 2009 and March 2018, and roughly 373% in New York between May 2009 and May 2018.[3] Those are nine-year figures, and they work out to high-teens annualized growth for that segment off the bottom. Individual artist markets moved even more: the auction record for Jean-Michel Basquiat climbed from $5.8 million through 2009 to $110.4 million by 2017.[3]
We are careful with that comparison, because survivorship bias is real and the post-2008 decade was unusually strong. Broad all-art indices that include weaker segments returned far less, closer to mid-single digits annualized over long horizons.[4] The honest read is that the investment-grade end of the market, the segment we focus on, recovered fast and compounded hard, while the average of everything recovered slowly. Quality is what recovers.
5. How the art cycle differs from the equity cycle
Art cycles look like equity cycles in shape but differ in three ways that matter for timing: lag, length, and correlation.
Lag. Art tends to turn after equities. Equity markets often peak before the broader economy, while art auction prices and volumes peak after equity bull markets and after the wealth they create.[6] Studies using time-series models put the lag on the order of one to three years, roughly 4 to 12 quarters.[6] The 2022 art peak arrived after the late-2021 equity high. The recovery that began in 2025 trailed the equity rally of 2023 and 2024. If you are using stocks as a leading indicator for art, you have to wait. Capital also reroutes for reasons that have nothing to do with the equity cycle, which we cover in <a href="/academy/posts/how-geopolitical-crises-redirect-art-capital-flows-a-historical-pattern-analysis">how geopolitical crises redirect art capital flows</a>.
Length. Equity corrections can resolve in weeks. Art corrections run for years, because the market is structurally illiquid. There is no exchange, selling means consigning to auction or negotiating privately, works are typically held 10 to 15 years, and round-trip transaction costs can approach 50%, so a work has to appreciate meaningfully before a sale even makes sense.[9] That friction slows every phase of the cycle in both directions.
Correlation. Over long periods, fine art's correlation to the S&P 500 has been measured in a wide band, with most academic estimates falling between about -0.03 and +0.25, and its correlation to gold sits near zero, generally within plus or minus 0.10.[6] Researchers stress that the confidence intervals around these figures are very wide, so we treat them as directional rather than precise. The takeaway holds either way. Art moves to a rhythm largely indifferent to the forces driving stocks. That is what diversification is supposed to mean, an asset that does its own thing, an asset that is not reliably up only when stocks are down.
6. Where the art market sat at the start of 2026
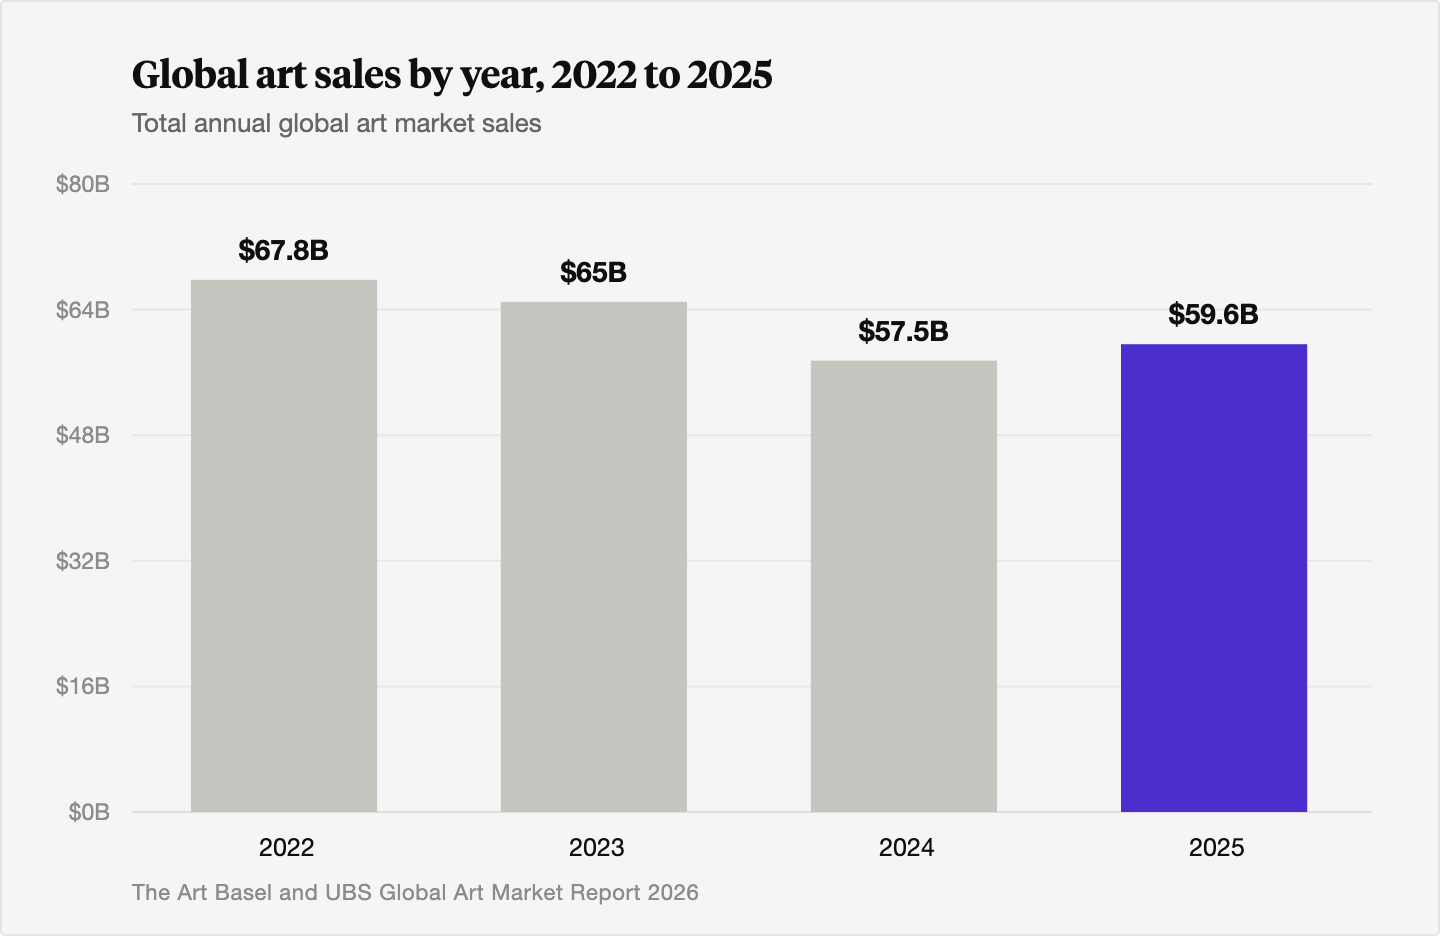
The most recent cycle ran from the 2021 expansion to a 2022 peak, a correction through 2024, and the early stage of a recovery in 2025. After the market reached an estimated $67.8 billion in 2022, sales slipped to roughly $65 billion in 2023, down 4%, then fell 12% to $57.5 billion in 2024, the second straight annual decline.[1][7] In 2025, total sales rose 4% to an estimated $59.6 billion, the first year of growth after the contraction.[1]
The internal picture is more telling than the headline. Public auction sales, the high end where the correction hit hardest, fell 25% in 2024 and then rebounded 9% in 2025 to $20.7 billion.[7][1] Transaction volume rose in both years, to 40.5 million in 2024 and 41.5 million in 2025, which says demand never left, it moved down-market to lower price points while the trophy end repriced.[7][1] The United States held about 44% of global sales, the United Kingdom 18%, and China 14%.[1] Asian buyers stayed central but bid more selectively, focused on best-of-breed material.[7] Sentiment firmed heading into 2026, with 43% of dealers expecting sales to improve and 38% expecting them to hold steady.[1]
That combination, volume up, auctions recovering, sentiment improving, quality starting to return, is what the early part of a recovery has looked like in past cycles. We believe the repricing of the high end may have largely run its course, though we would caution that one year of growth is not a trend, and macro and geopolitical risk could still slow it.
7. What the cycle means for timing
Knowing the phase changes what an investor should do, and the logic is the opposite of the instinct most people have.
The hardest time to sell is in a correction. When the best material is being withheld and buyers are thin, you are selling into the weakest demand and the widest spreads. Owners who can wait, wait. The 3 to 10 year holding period that art demands is what lets a patient seller skip the bad part of the cycle entirely.
The best time to buy, historically, has been near the bottom, when sellers are discouraged and quality occasionally has to come to market anyway, through death, divorce, or debt. Buffett's line is to be greedy when others are fearful. We do not pretend to possess his wisdom, but the historical record is consistent: the investors who showed up near the 2009 trough captured the steepest part of the recovery.
The trap is the peak. A market that is setting records on the back of a single buyer or a flood of cheap money, as in 1990 and arguably 2021, is the most dangerous moment to be paying up. Concentration of demand is the warning sign, not the price level itself.
None of this is a market-timing system. We cannot tell you the bottom is in, and anyone who claims to is guessing. What the cycle gives you is a way to think about risk and patience, a way of thinking rather than a signal to trade on. For one set of leading indicators that hint at where a cycle is heading, see <a href="/academy/posts/what-auction-estimates-reveal-about-market-direction">what auction estimates reveal about market direction</a> and the companion piece on <a href="/academy/posts/reading-the-tape-auction-estimates-as-a-signal-of-market-direction">reading the tape, auction estimates as a signal of market direction</a>.
The Bottom Line
- Art market cycles move through four phases: an expansion driven by rising top-end wealth, a peak when prices and supply both run hot, a correction that typically lasts two to three years, and a recovery that starts with volume and quality before prices follow.
- The turns are driven by wealth creation at the very top, by liquidity and interest rates, and by whether owners choose to bring quality work to market or withhold it. In downturns, sellers hold their best pieces, which props up headline prices and masks soft demand.
- The art cycle lags the equity cycle by roughly one to three years, runs longer because the market is structurally illiquid with 10 to 15 year holding periods, and shows low long-run correlation to stocks and near-zero correlation to gold.
- History shows two very different correction profiles. The Japanese Impressionist bust of the early 1990s saw prices fall more than 50% and took about 15 years to recover, because demand was concentrated in one buyer. The 2008 crash cut global sales 40% but the investment-grade segment recovered fast, with post-war and contemporary evening-sale averages up roughly 373% to 413% over the following nine years.
- At the start of 2026 the market was in the early stage of a recovery: total sales rose 4% to an estimated $59.6 billion in 2025 after two down years, public auctions rebounded 9%, transaction volume rose, and dealer sentiment improved.
- For investors, the cycle argues for patience over timing: the hardest time to sell is a correction, the historically best time to buy has been near a bottom, and the most dangerous moment is a peak built on concentrated demand. Past performance is not predictive.
Sources
- Arts Economics. "The Art Basel and UBS Global Art Market Report 2026." Art Basel and UBS, March 2026. https://www.artbasel.com/stories/the-art-basel-and-ubs-global-art-market-report-2026
- Vincent, Steve / Los Angeles Times reporting, summarized in "The Japanese Art Bubble" retrospective and contemporary Los Angeles Times coverage (January 1993). https://www.latimes.com/archives
- Gerlis, Melanie. "Rolling with the punches: how the art market bounced back." The Art Newspaper, September 4, 2018. https://www.theartnewspaper.com/2018/09/04/rolling-with-the-punches-how-the-art-market-bounced-back
- "Art as a Financial Investment: Long-Run Returns and Risk." European Financial Management Association working paper, 2023. https://www.efmaefm.org/0EFMAMEETINGS/EFMA%20ANNUAL%20MEETINGS/2023-UK/papers/EFMA%202023_stage-4455_question-Full%20Paper_id-72.pdf
- Masterworks. "What Happens to Art During a Recession?" Masterworks Insights, accessed June 2026. https://insights.masterworks.com/alternative-investments/art-investing/what-happens-to-art-during-a-recession/
- Elton, Edwin, and Kathryn Graddy, summarizing Renneboog and Spaenjers, Kraeussl and Logher, and Campbell et al. "The Art Market: What Do We Know about Returns?" SSRN, 2015 (updated 2016). https://papers.ssrn.com/sol3/papers.cfm?abstract_id=2636269
- Arts Economics. "The Art Basel and UBS Global Art Market Report 2025." Art Basel and UBS, April 8, 2025. https://theartmarket.artbasel.com/the-art-market-2025
- CKGSB / Sotheby's Mei Moses. "Mei Moses Art Indices Spring 2025 Report." CKGSB, July 2025. https://english.ckgsb.edu.cn/knowledge/wp-content/uploads/2025/07/Report_MM-Art-Indices_Spring-2025_Final.pdf
- Center for Art Law. "Art Price Indices: Op-Ed." Center for Art Law, accessed June 2026. https://itsartlaw.org/art-law/art-price-indices-op-ed/
- Reyburn, Scott. "Global art sales rose 4% to $59.6 billion in 2025." Family Wealth Report / Art Basel coverage, March 12, 2026. https://www.familywealthreport.com/article.php/US-Remained-Largest-Art-Market-In-2025
- FAD Magazine. "Global Art Market Report 2026: Art Sales Reach $59.6 Billion." FAD Magazine, March 12, 2026. https://fadmagazine.com/2026/03/12/global-art-market-report-2026-art-sales-reach-59-6-billion/
- Artnet News. "The Latest UBS Art Basel Report Puts the Global Art Market at $67.8 Billion." Artnet News, 2023. https://news.artnet.com/market/latest-ubs-art-basel-report-2023-shows-art-market-recovery-2279726
- Kraeussl, Roman, and Robin Logher. "Art as an Investment: The Top 500 Artists." European Financial Management Association, 2010. https://www.efmaefm.org/0efmsymposium/2011-toronto/papers/kraeussl.pdf
- American Economic Association. "Art Auctions: Price, Volume, and the Macroeconomy." AEA research charts. https://www.aeaweb.org/research/charts/art-auctions-price-volume-macroeconomy
Disclosures
Investing involves risk. Past results are not indicative of future outcomes.
Masterworks is providing this communication as an agent for its issuer entities, not Masterworks Advisers. This material is produced by Masterworks for informational purposes only and does not constitute investment advice, a recommendation, or an offer or solicitation to buy or sell any security. Masterworks is not a licensed broker-dealer by the SEC or FINRA.
Masterworks can only make and accept sales after an offering statement has been filed, and "qualified", by the SEC. Any offers may be revoked before notice of qualification. Indications of interest involve no obligation. For further disclosure visit the offering documents filed with the SEC and Important Disclosures at masterworks.com/cd.
Forward-looking statements and internal estimates are based on assumptions that may prove incorrect, and actual outcomes may differ materially. Figures denoted in brackets are subject to confirmation. Investing in art and alternative assets involves risk, including loss of principal.
Art sales price data is comparative only. Each painting is unique and historical data is not a direct proxy for any specific painting or investment. Data represents whole art, not an investment into our offerings which includes fees and expenses. Any comparative images are not currently live offerings and are provided for educational purposes only.
Masterworks, LLC is located at 1 World Trade Center, 57th Floor, New York, NY 10007.


