
Masterworks Research · June 2026
How sell-through, value concentration, and bidding behavior differ across the $100K, $1M, and $10M+ tiers, and what that structure means for where an investor chooses to stand.
The art market is not one market. A $40,000 print and a $40 million painting trade under the same roof, sometimes in the same week, but they behave like different asset classes. Works priced above $10 million sell more reliably than works under $100,000, the most expensive 1.7% of lots account for close to 60% of the money that changes hands, and bidding patterns invert as you climb the price ladder. For an investor deciding where on that ladder to stand, the tier you choose shapes your liquidity, your volatility, and how much of your return depends on a handful of buyers at the very top. We pulled the auction record to show what actually separates the tiers.
What You Need to Know
- Sell-through rises with price. Across more than 400,000 auction lots from mid-2020 through mid-2026, the share of offered lots that sold climbed from 77.1% under $100,000 to 91.8% above $10 million. Expensive works find buyers more reliably than cheap ones.
- Value is concentrated at the very top. Works above $1 million were about 1.7% of lots but roughly 58% of hammer value, and the 570 lots above $10 million alone, 0.14% of everything offered, were more than a fifth of the value.
- Bidding behavior inverts as prices rise. At the bottom, 37% of sold lots beat their high estimate in live competition; at the top, only 13% did, and more than a third of $10 million-plus lots hammered below their low estimate because guarantees anchor the floor.
- The volatility you read about is a high-end story. Sales above $10 million fell 45% in value in 2024 and rebounded around 30% in 2025, swinging the entire auction total with them.
- The figures come from completed transactions, not a forecast. We tiered roughly 403,000 lots by pre-sale estimate from the Masterworks research database of public auction results; the data describes market structure and does not predict future returns.
1. How we measured this, and what the tiers are
A note on how we know this. We looked at more than 400,000 fine art lots that came to public auction with a published estimate over the roughly six years from July 2020 through mid-June 2026, drawn from the Masterworks research database of public auction results. We sorted every lot into a tier by its pre-sale estimate, because an estimate exists whether or not a work sells, which lets us compare what happens to expensive and inexpensive lots on the same basis. Of 408,824 lots offered in the period, 403,250 carried a published estimate, so the sample covers almost the entire offered market rather than a curated slice of it.
Four tiers, anchored on the three thresholds in the title:
- Under $100,000: about 350,900 lots, the entry and mid-market.
- $100,000 to $1 million: about 45,300 lots.
- $1 million to $10 million: about 6,460 lots.
- $10 million and above: 570 lots over six years.
Sell-through here means the share of offered lots that sold, with the denominator being lots that sold plus lots that were bought in (failed to meet their reserve). Hammer prices are pre-premium and converted to US dollars. Withdrawn lots are excluded.
2. Why sell-through rises as prices rise
Most people assume cheap art is easy to sell and expensive art is hard. The data shows the reverse. Sell-through climbs steadily with price:
- Under $100,000: 77.1% of offered lots sold.
- $100,000 to $1 million: 77.6%.
- $1 million to $10 million: 86.1%.
- $10 million and above: 91.8%.
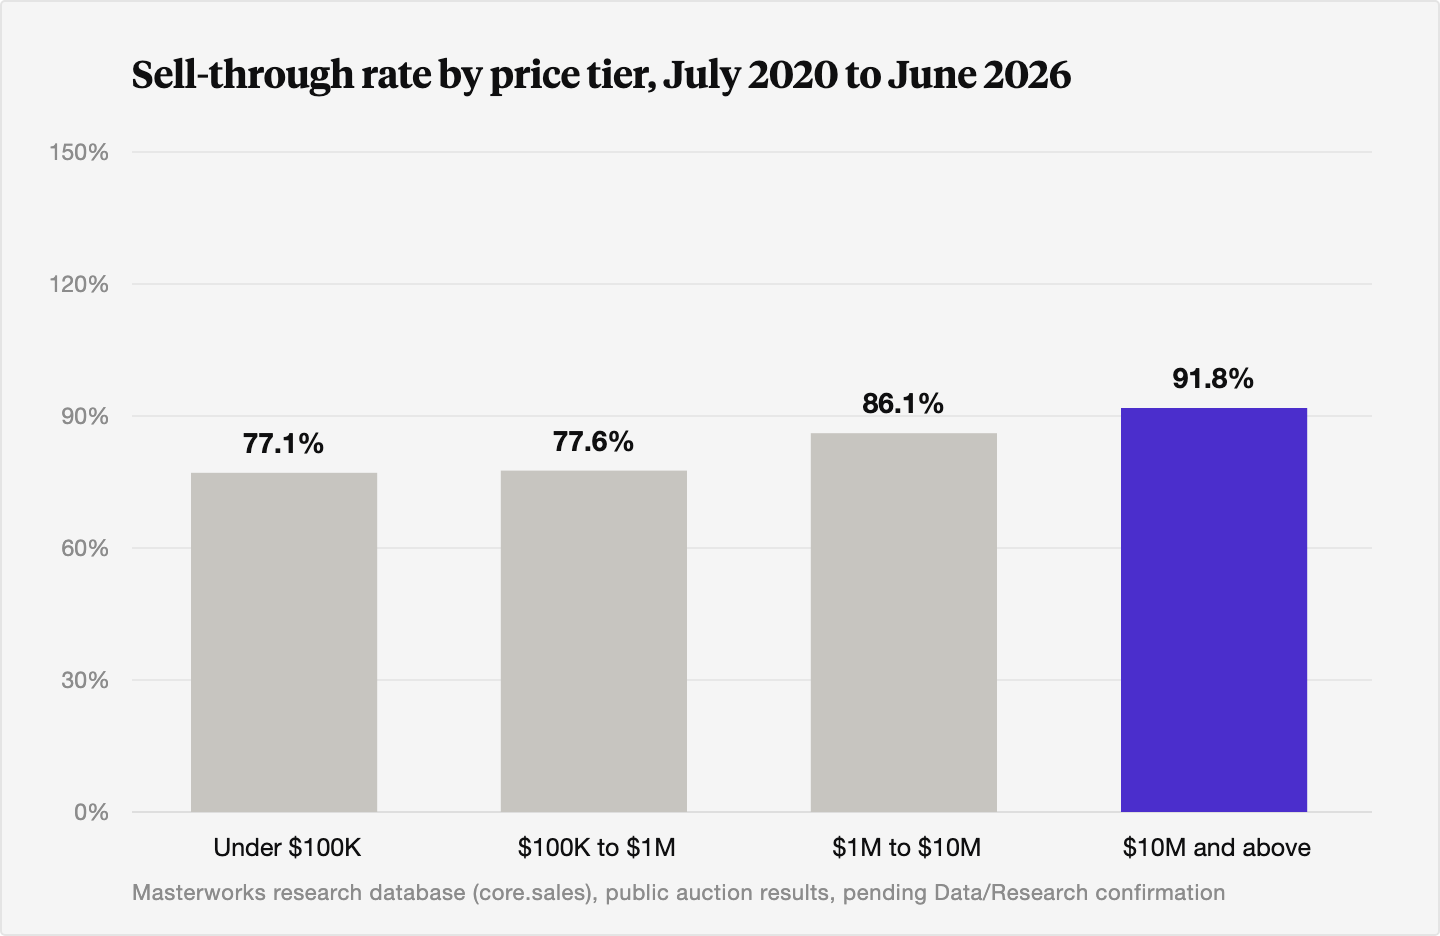
A work estimated above $10 million was far more likely to find a buyer than a work estimated under $100,000. Three things drive that. The auction houses are ruthlessly selective about what they accept at the top, so the trophy lots are pre-vetted for demand. The buyers at that level are deep-pocketed and few, and the houses know most of them by name. And the high end runs on guarantees. In recent New York evening sales, something like 80% to 95% of the top lots carry a house or third-party guarantee, a commitment from a backer to buy the work at a set price if no one else does.[1] A guaranteed lot is close to pre-sold, so it rarely shows up as a public failure.
The lower tiers get none of that scaffolding. A $30,000 lot in a day sale is exposed to live demand with no backstop, no guarantor, and a thinner, more price-sensitive pool of bidders. When the room is quiet, it goes unsold. That is why buy-in rates run higher at the bottom even though, in dollar terms, the stakes are small.
3. Where the money actually is: value concentration by tier
The number of lots in each tier tells you almost nothing about where the value sits. Sort the same period by hammer value and the market turns into a pyramid with a very heavy top.
- Under $100,000: 87% of lots, about 15% of value.
- $100,000 to $1 million: 11% of lots, about 27% of value.
- $1 million to $10 million: 1.6% of lots, about 36% of value.
- $10 million and above: 0.14% of lots, about 22% of value.
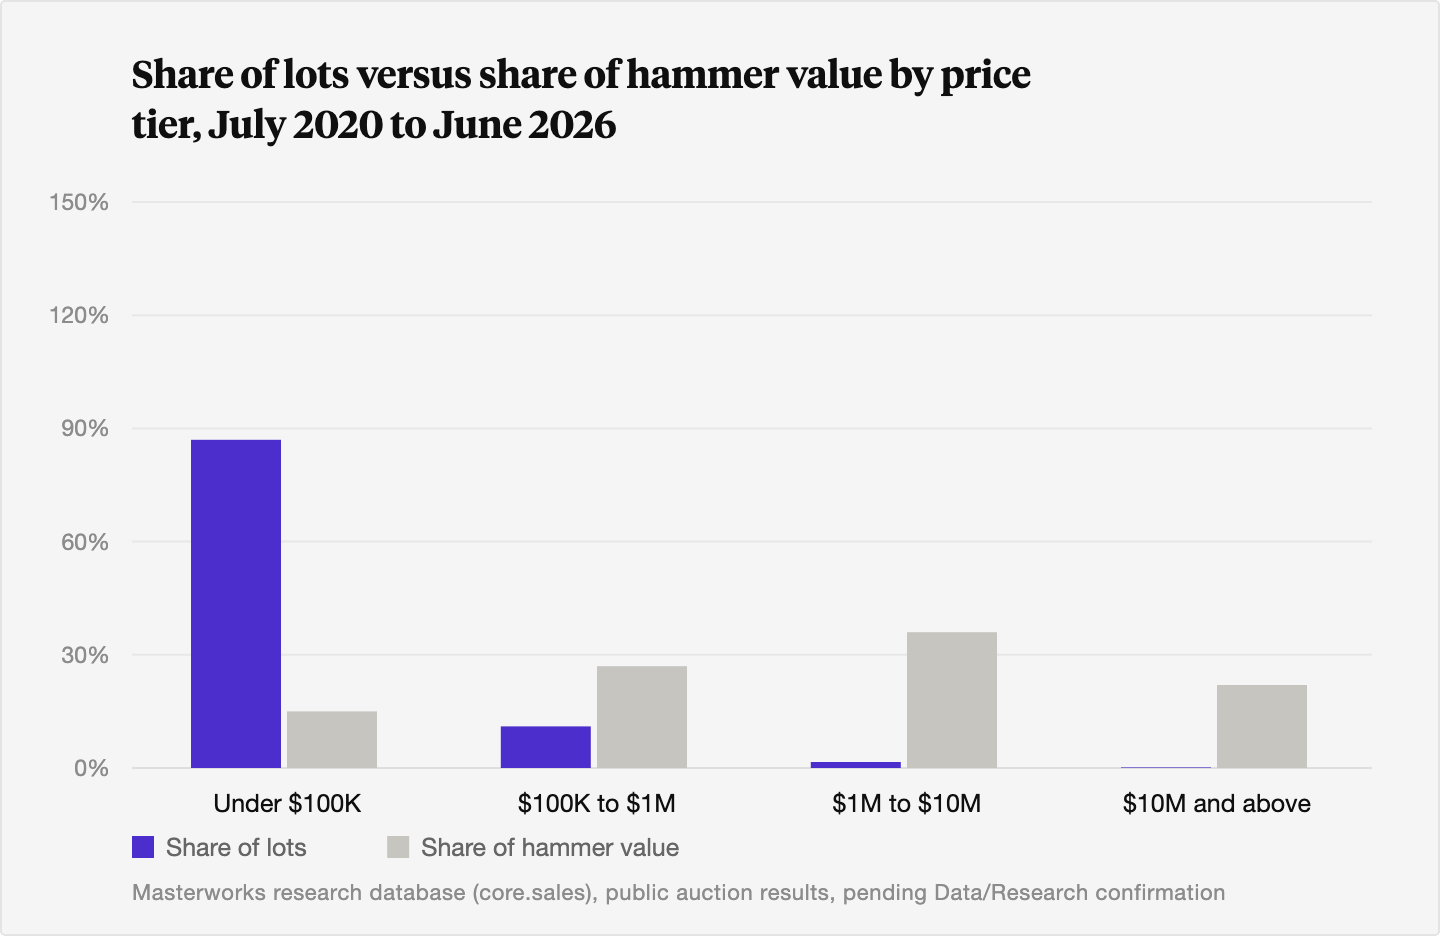
Put the top two tiers together. Works above $1 million were 1.7% of lots and roughly 58% of the money. The 570 lots above $10 million, fourteen-hundredths of one percent of everything offered, were more than a fifth of the value by themselves. We tend to think about the high end as a call option on the top 1%, really the top 0.01%. The data is the clearest way to see it. What happens to a few hundred trophy lots a year sets the tone for the entire market.
That concentration is also why the headline art market looks so volatile. When the Art Basel and UBS Global Art Market Report measured 2024, the value of works sold at auction above $10 million fell 45% and the number of them fell 39%, which dragged the public auction market down 25% to about $19 billion.[2][3] In 2025 the same top tier rebounded, with sales above $10 million up around 30% and the auction market back up roughly 9% to about $20.7 billion.[4] The bottom of the market, the under-$5,000 lots, grew through both years. The swing investors read about every January is mostly a story about a few hundred expensive paintings.
4. How bidding behavior flips across the tiers
The tiers also disagree about estimates, and the pattern reverses as you go up. We measured how often a sold lot hammered above its high estimate (a sign of competition) versus below its low estimate (a sign of a soft or pre-arranged sale):
- Under $100,000: 37% sold above the high estimate, 27% below the low.
- $100,000 to $1 million: 30% above high, 25% below low.
- $1 million to $10 million: 22% above high, 32% below low.
- $10 million and above: 13% above high, 35% below low.
At the bottom, more than a third of lots blew past their high estimate. That is real, live price discovery: a cheap lot with two motivated bidders can run well past where the specialist set it. At the top, the opposite. Only 13% of $10 million-plus lots beat the high estimate, and more than a third hammered below the low one.
The guarantee explains most of it. When a backer has agreed to buy a work at a level set near the low estimate, that level becomes the floor, and often the ceiling too. If no independent bidder wants to go higher, the lot sells to the guarantor at the guaranteed price, which can sit at or even slightly below the published low estimate.[1] The November 2025 sale of Klimt's "Portrait of Elisabeth Lederer" is the textbook case. It hammered at $205 million against an estimate around $200 million and made $236.4 million with fees, the most valuable work of modern art ever sold at auction and the second most valuable artwork of any kind, and it was a guaranteed star lot in a single-owner collection.[5] A near-certain sale, anchored near the low estimate. That is how the top of the market clears.
For an investor reading auction results, the lesson is that a high-end "sell-through" and a low-end "sell-through" are not the same signal. One reflects a pre-negotiated floor. The other reflects what buyers were actually willing to pay that night. We cover how to read those tells in our pieces on what auction estimates reveal about market direction and on the guarantee system.
5. What each tier means for an investor
Tier is a decision about liquidity and volatility before it is a decision about taste.
The entry market, under $100,000, is the most accessible and the most active by volume, and it gives you the truest read on live demand. It is also the noisiest. Sell-through is lower, quality varies enormously, and a single result tells you little. This is the part of the market most exposed to fashion and to the breadth of collector interest in a given name.
The middle, roughly $1 million to $10 million, is where we think the most investable dynamics live. Sell-through is high (86%), the works are good enough to attract serious buyers, and the segment is deep enough to sell into without being so thin that you depend on one or two billionaires showing up. Scott Lynn has compared investment-grade art to beachfront property: there is a lot of real estate, but only a small share of it actually appreciates, and the appreciating share is not at the very cheap end or, necessarily, at the trophy extreme. We covered the danger of leaning on any single name in concentration risk in art.
The trophy tier, $10 million and up, sells reliably and carries the cultural weight, but it comes with real trade-offs. Liquidity depends on a handful of buyers, guarantees can mask thin demand, and the entry ticket is out of reach for almost everyone, which is part of why fractional ownership exists at all. Reliable does not mean cheap to be wrong in. When the top tier corrects, it corrects hard, as 2024 showed.
6. The limits of reading the tape this way
We would not want anyone to overread this. The figures cover public auction only, and roughly half of the art market trades privately, where prices are rarely disclosed, so the most discreet high-end deals never enter a dataset like this. Estimates are set by the houses and are not neutral. They are marketing as much as measurement, which means tiering by estimate inherits whatever bias the specialists bring. Guarantees, as we have said, turn some "sales" into pre-arranged transfers, so a high-end sell-through rate overstates how hot the room really was. And none of this is predictive. These are six years of completed transactions, and past performance in any tier is not a guide to future results. What the data does well is show structure: which parts of the market are liquid, where the value concentrates, and how differently the tiers behave when the gavel comes down.
The Bottom Line
- Art price tiers behave like different markets. Sell-through rose steadily from about 77% for works under $100,000 to roughly 92% for works above $10 million across more than 400,000 auction lots from mid-2020 through mid-2026.
- Value is heavily concentrated at the top. Works above $1 million were about 1.7% of lots but close to 58% of hammer value, and works above $10 million alone, 0.14% of lots, were more than a fifth of the value.
- The volatility you read about in the art market is mostly a high-end story. Sales above $10 million fell 45% in value in 2024 and rebounded around 30% in 2025, swinging the whole auction total with them.
- Bidding behavior inverts with price. At the bottom, 37% of lots beat their high estimate in live competition. At the top, guarantees anchor most trophy lots at or below their low estimate, so a high-end sale signals a pre-arranged floor more than a bidding war.
- For most investors, the deepest combination of liquidity and quality has historically sat in the middle of the market rather than at the cheap entry point or the trophy extreme. Public auction data excludes private sales, and none of these patterns predict future returns.
Sources
- The Art Newspaper. "Klimt's 'Portrait of Elisabeth Lederer' makes $236.4m at Sotheby's, the second highest auction price ever." November 18, 2025. https://www.theartnewspaper.com/2025/11/18/klimt-record-sothebys-new-york-lauder-collection
- Art Basel and UBS. "The Art Market 2025: Global Market." Art Basel, 2025. https://theartmarket.artbasel.com/the-art-market-2025/global-market
- Art Basel. "The Art Basel and UBS Global Art Market Report 2025." Art Basel News, 2025. https://www.artbasel.com/news/the-art-basel-and-ubs-global-art-market-report-2025
- Family Wealth Report. "US Remained Largest Art Market In 2025, Art Basel, UBS Report." 2026. https://www.familywealthreport.com/article.php/US-Remained-Largest-Art-Market-In-2025-%E2%80%93-Art-Basel,-UBS-Report
- Sotheby's. "Gustav Klimt, Bildnis Elisabeth Lederer, The Collection of Leonard A. Lauder." Sotheby's, November 2025. https://www.sothebys.com/buy/f3db82c8-d736-41f8-80cc-d0ac9e8086c9/lots/9b5c688e-6fd4-4de0-a8ff-c79ea1a324cf
- Artsy. "5 Key Takeaways from Art Basel and UBS's Report 'The Art Market 2025'." Artsy, 2025. https://www.artsy.net/article/artsy-editorial-5-key-takeaways-art-basel-ubss-report-the-art-market-2025
- UBS. "Art market research." UBS, 2025-2026. https://www.ubs.com/global/en/our-firm/art/art-market-research.html
- Masterworks research database (core.sales), public auction results, July 2020 to June 2026. Internal aggregate analysis, pending Data/Research confirmation.
Disclosures
Investing involves risk. Past results are not indicative of future outcomes.
Masterworks is providing this communication as an agent for its issuer entities, not Masterworks Advisers. This material is produced by Masterworks for informational purposes only and does not constitute investment advice, a recommendation, or an offer or solicitation to buy or sell any security. Masterworks is not a licensed broker-dealer by the SEC or FINRA.
Masterworks can only make and accept sales after an offering statement has been filed, and "qualified", by the SEC. Any offers may be revoked before notice of qualification. Indications of interest involve no obligation. For further disclosure visit the offering documents filed with the SEC and Important Disclosures at masterworks.com/cd.
Forward-looking statements and internal estimates are based on assumptions that may prove incorrect, and actual outcomes may differ materially. Figures denoted in brackets are subject to confirmation. Investing in art and alternative assets involves risk, including loss of principal.
Art sales price data is comparative only. Each painting is unique and historical data is not a direct proxy for any specific painting or investment. Data represents whole art, not an investment into our offerings which includes fees and expenses. Any comparative images are not currently live offerings and are provided for educational purposes only.
Masterworks, LLC is located at 1 World Trade Center, 57th Floor, New York, NY 10007.


