
Masterworks Research · June 2026
Why long holding periods capture the illiquidity premium, how recoveries compound for years after a correction, and what forced sellers give up by selling early.
Patience is rewarded in art markets because the structure of the market pays long holders and penalizes short ones. Round-trip transaction costs run 30 to 45% of a work's value, so a sale must clear a high hurdle before it returns anything, and the only way to lower that hurdle is to spread it across more years [1]. Past corrections have taken three to five years to recover at the market level and longer at the segment level, which means the investors who held through the trough captured the recovery while the forced sellers locked in the loss [2]. For an investor weighing whether art belongs in a portfolio, the practical point is that art is a long-term, illiquid allocation, and most of its documented return accrues to people who treat it that way. Past performance is not predictive. The patience the data rewards is the patience to hold through a cycle, and the historical record describes what has happened rather than what the next cycle will do.
What You Need to Know
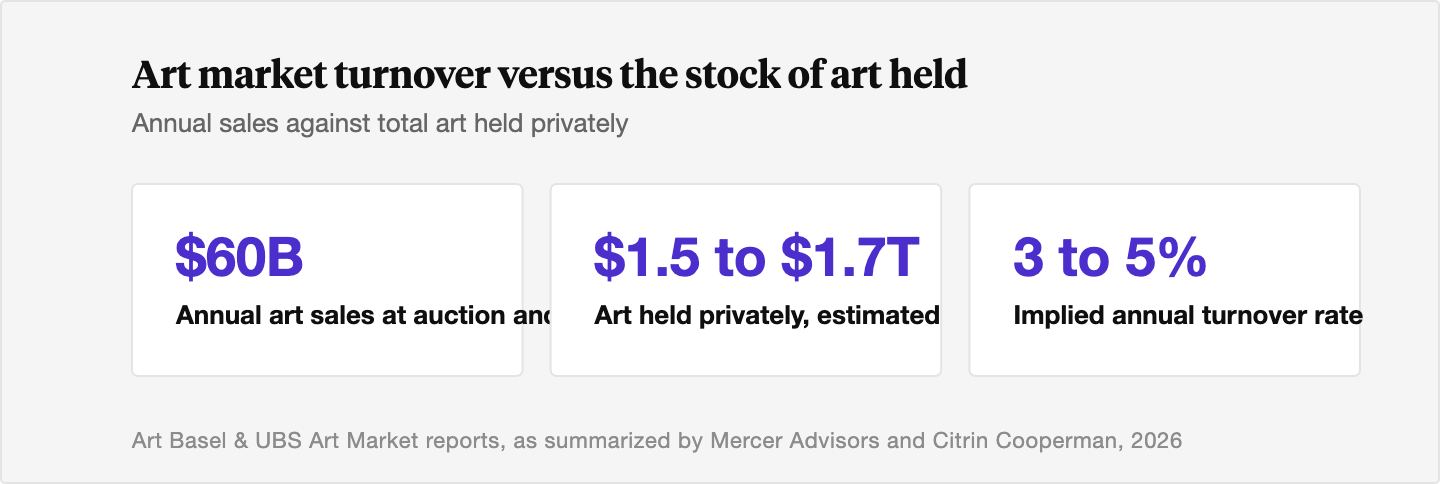
- Art turns over slowly by design. Annual sales of roughly $60 billion sit against an estimated $1.5 to $1.7 trillion stock of art held privately, which works out to only about 3 to 5% of the market changing hands in a year [3]. Low turnover is the market telling you it runs on multi-year holds.
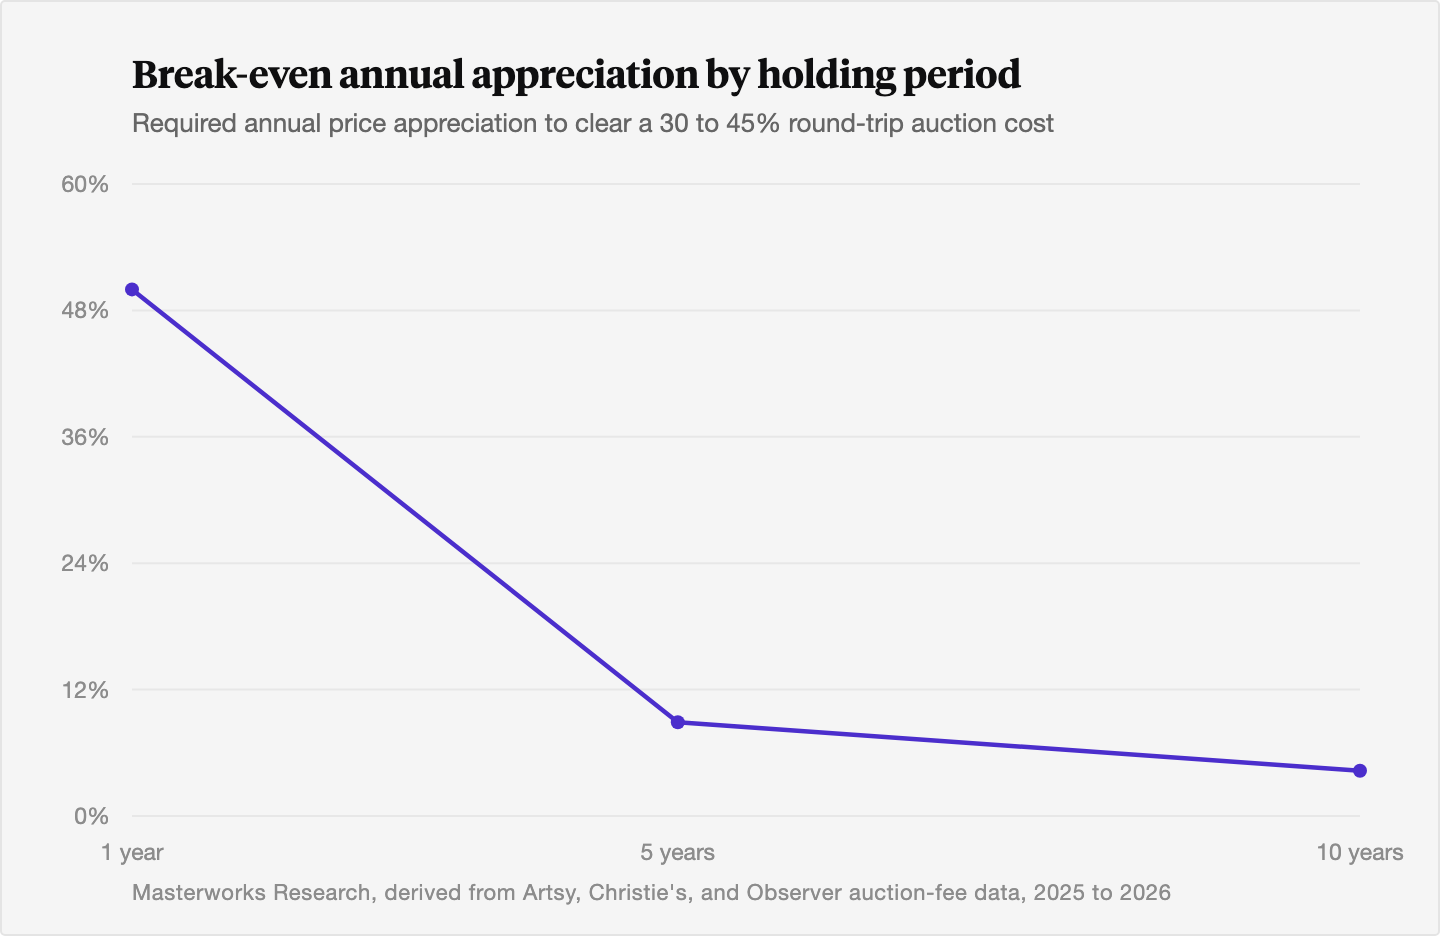
- Transaction costs reward time. A round-trip through a major auction house can cost 30 to 45% of a work's value, so the hammer price often needs to rise roughly 50% just to break even. Sold after one year that is an unrealistic hurdle. Spread over ten years it falls to about 4% a year [1].
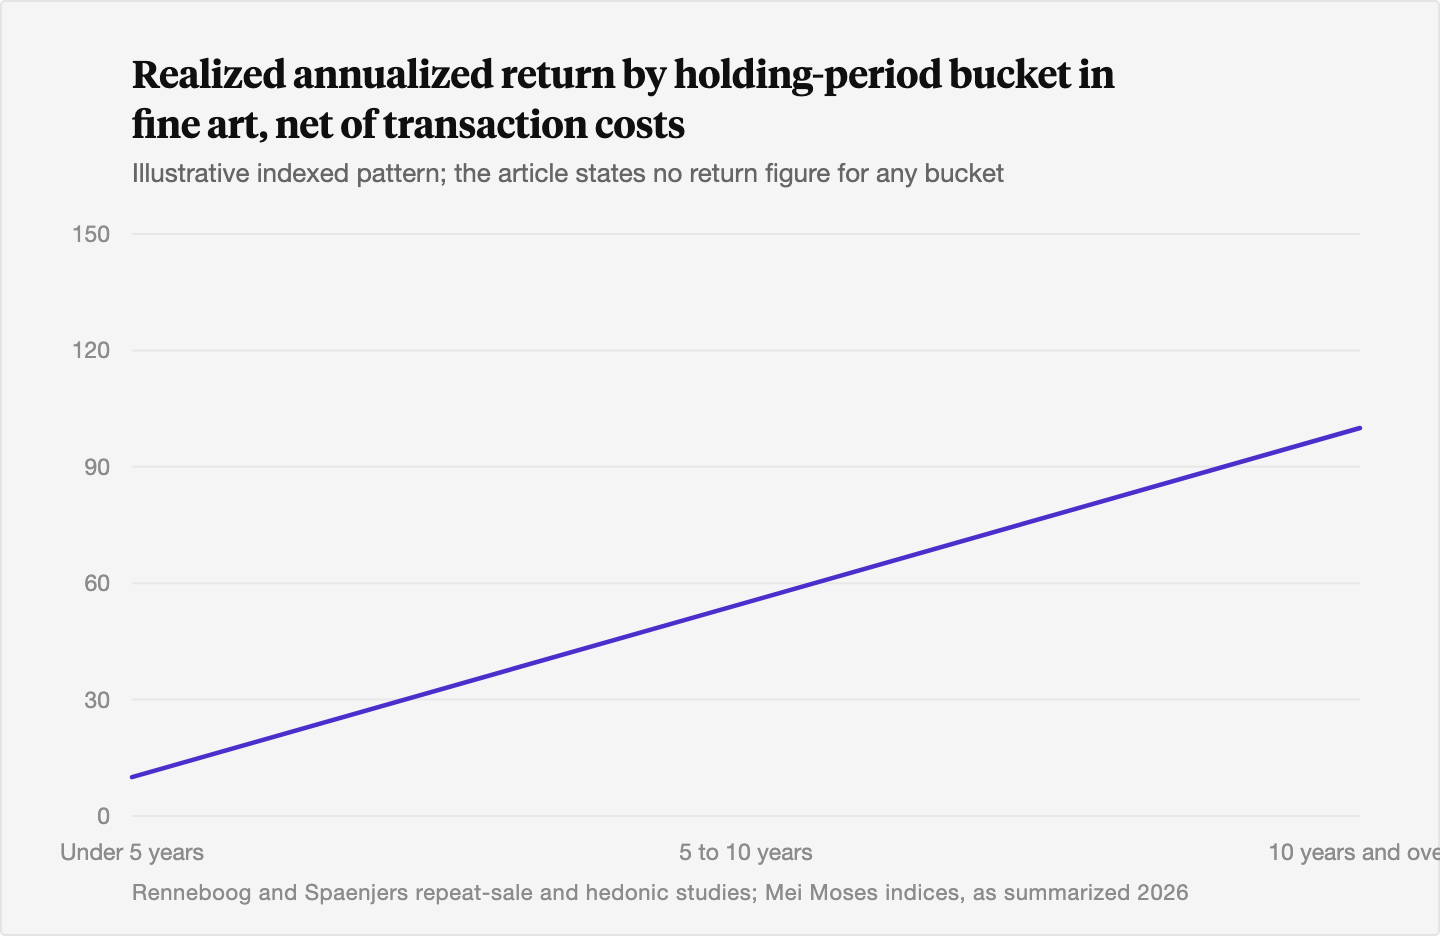
- The illiquidity premium accrues to patient holders. In segmented markets the required compensation for locking up capital rises with the holding period, and academic models put it above 4% for a five-year hold [4]. In art specifically, repeat-sale studies show realized returns climb as the holding period lengthens, because fixed costs get amortized over more years [5].
- Recoveries take years, and they compound. After the 2008 to 2009 crisis, market value fell about 36% and took roughly three to five years to regain its prior level [2]. The early-1990s Japanese-driven Impressionist bubble fell 37% in a single year and took 10 to 20 years to recover at the segment level [6]. The recovery is the return, and you only collect it if you are still holding.
- The 3 D's force sales at the wrong time. Death, divorce, and debt push works onto the market on legal and tax calendars rather than market cycles. Forced sellers take what the room offers. Patient holders choose when to sell [7].
1. Why turnover is low and holding periods are long
Start with the size of the gap. Roughly $60 billion of art changes hands at auction and through dealers in a year, against an estimated $1.5 to $1.7 trillion of art held by private collectors [3]. That is a turnover rate of about 3 to 5% by value. For comparison, the entire stock of art trades less in a year than a single large equity does in a week. A low turnover number tells you how the market is meant to be used. Works are bought to be held.
The professional estimates of how long people actually hold line up with that math. Investment-grade works are commonly held 10 to 20 years [8]. Repeat-sale academic studies, which track the same work across two auction appearances, routinely find a decade or more between sales [5]. We treat art as a long-term illiquid allocation for the same reason, with a target hold of roughly 3 to 10 years per work and art usually sitting under 5% of a portfolio to start.
A note on how we know the holds are long. The cleanest evidence is the repeat-sale record itself. When the same Warhol or the same Basquiat sells in 2014 and again in 2025, the years between those two transactions are a direct measurement of how long the work sat with one owner. Across large samples of those pairs, the gap is consistently measured in years and often in decades [5]. The data is built from the same auction record that has existed since long before financial markets did.
So the long holding period is simply the rate at which the asset class actually moves. The market sets it, and an investor inherits it.
2. How long holds capture the illiquidity premium
The illiquidity premium is the extra return investors expect for owning something they cannot sell quickly. It compensates for the cost, the delay, and the inconvenience of being unable to exit on demand [9]. In private markets the premium is real and measurable: research summarized by the CFA Institute puts the realized spread over public benchmarks at roughly 2 to 4% a year for buyout funds and 3 to 5% a year for early-stage venture, over lockups that run eight to twelve years [10].
The part that matters for patience is how the premium scales with time. In a market segmented between short-horizon and long-horizon investors, the compensation required for illiquidity rises with the expected holding period. A model reviewed by the CAIA Association puts the net required premium above 4% for a holding period of around five years [4]. The longer you can lock up capital, the larger the spread you are owed for doing so.
Art shows the same pattern in its realized returns. Repeat-sale and hedonic studies, including the work of Renneboog and Spaenjers and the Mei Moses indices, find that returns net of costs are low or negative over short holds and converge toward the underlying index return over long ones [5]. Short holds under five years cluster near zero after costs. Holds of ten years or more tend to reach the index-level appreciation. The market effectively transfers return from impatient sellers to patient holders, and the size of that transfer in art has been estimated at several percentage points a year [5]. For how those long-run art returns stack up against equities, see our comparison of art versus stocks over the last 30 years.
The mechanism is simple and we will walk it in the next section. In art, patience is the thing that gets paid.
3. Why transaction costs punish short holds
Imagine you buy a work at auction and sell it through the same channel a few years later. On the way in you pay a buyer's premium. Sotheby's raised its US premium to 28% on lots up to $2 million in February 2026, and Christie's and Phillips sit in the same range [11]. Add sales tax, shipping, and insurance and the all-in cost of acquiring can reach 30 to 35% of the hammer price [1]. On the way out you pay a seller's commission of 5 to 15%, plus insurance while the work is in the house, cataloguing, and shipping, which lands the exit cost around 10 to 20% [1].
Put the two together and a round trip through a major auction house costs 30 to 45% of the work's value [1]. Here is what that does to the math. To clear those costs, the hammer price has to rise by roughly 50% before the sale returns a single dollar of profit.
Now apply a holding period to that 50% hurdle:
- Sell after one year, and you need roughly 50% price appreciation in a single year just to break even. That essentially never happens for a quality work.
- Sell after five years, and the same total increase annualizes to about 8.9% a year [1].
- Sell after ten years, and it falls to about 4.3% a year [1].
The friction does not change. The number of years you spread it across does. That is the entire reason short-term flipping through auctions is value-destructive in most cases, and the reason the cost structure itself requires a buy-and-hold horizon.
4. How long it has taken art to recover from past corrections
Every drawdown in the record has been followed by a recovery, and the recoveries have run for years. That is why selling into weakness is the costliest mistake an art investor can make. The work that pays the recovery is the work you still own when it arrives.
The 2008 to 2009 crisis. Global art market value fell from about $65 billion in 2007 to $39.5 billion in 2009, a decline of roughly 36% [2]. The Artprice index fell about 30% in 2008 and another 10% in 2009 [12]. Market value then recovered to its prior nominal level within roughly three to five years, reaching the mid-$60 billions by 2014 [2]. Blue-chip prices generally regained their peaks by the mid-2010s and kept climbing for several more years. The investors who held through 2009 collected that. The ones who sold into it did not.
The early-1990s Impressionist bubble. The late-1980s boom, driven heavily by Japanese corporate and individual buyers, produced what one long-run UK study calls the largest bubble in art history. It burst with a 37% real decline in the UK art index in 1991 [6]. At the segment level the recovery was long. Top-tier Impressionist trophies bought at 1989 and 1990 records often took 15 to 20 years to exceed those prices, and some have not in real terms [6]. The lesson is about segment selection as much as patience: a bubble fed by one disappearing buyer base recovers far more slowly than a broad-based market.
The 2022 to 2025 correction. After the pandemic-era peak, global market value fell about 4% in 2023 and a further 12% in 2024, with the auction segment down about 25% and the very high end deeper still [2]. By 2025 the published data points to a recovery underway: global sales of about $59.6 billion, up 4%, with public auction up 9% [13]. The recovery was sharply tiered by price band. Works over $10 million rose about 36% versus 2024, works between $1 million and $10 million rose about 21%, the $100,000 to $1 million band rose about 6%, and works under $100,000 were roughly flat [14]. Quality and scale led the turn, as they have in past cycles. The way the recovery split by price band is its own subject, covered in our price-tier analysis of how $100K, $1M, and $10M works behave differently.
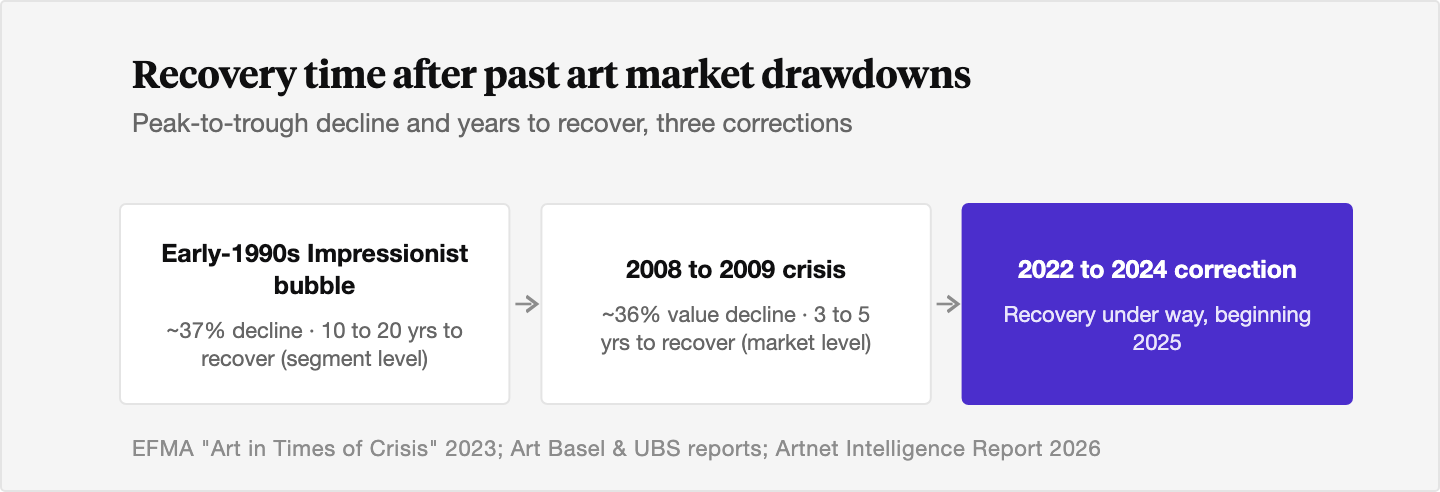
We do not pretend to know the timing of any recovery in advance. The honest read of the record is that drawdowns have always been followed by multi-year recoveries, and that the magnitude and speed vary by segment. The discipline the data supports is not selling into the trough. For the full anatomy of how these phases unfold, see our explainer on how art market cycles work, from expansion through peak, correction, and recovery.
5. The 3 D's and the cost of being a forced seller
In the art market the standard shorthand for why people sell is the 3 D's: death, divorce, and debt. These are the situations that force a sale regardless of where the market is.
Death drives estate sales, and estates run on tax and probate calendars, not on art-market cycles. Executors and heirs usually consign to the next appropriate auction season after valuation, with conservative estimates set to ensure the work clears, because the estate needs certainty and cash by a fixed date [7]. Divorce drives court-ordered or negotiated liquidation, where one party needs the proceeds and speed matters more than price [7]. Debt drives sales when a work pledged as collateral faces a margin call, or when a liquidity shortfall makes the art the asset that gets sold [7].
In every case the timing is set by someone else. The forced seller cannot walk away from a soft room, cannot wait for a stronger season, and cannot hold for the recovery. That asymmetry transfers value to the patient buyer on the other side of the table. The same opacity and thin liquidity that make art hard to trade quickly also make the discount on a hurried sale large [7]. This is the structural reason a downturn produces both lower prices and more selling at once. The people who must sell are concentrated exactly when prices are worst. The supply dynamics behind death-driven selling are worth understanding in their own right, which we cover in our piece on estate sales and artist deaths and how supply shocks affect prices.
The defense is to never be the forced seller. That means liquidity planning so a bad year elsewhere does not force an art sale, estate planning so heirs inherit the option to hold rather than a deadline to sell, and debt discipline so a collection is not the collateral that gets called. Treating art as a long-term, illiquid allocation, usually under 5% of a portfolio to start, is what keeps the choice of when to sell in your hands rather than someone else's.
6. What patience looks like in practice
Patience in art comes down to a set of specific decisions. It means sizing the allocation so you are never forced to sell it, choosing the segment with an eye to how it recovers, and holding through a correction rather than realizing the loss at the bottom.
It also means knowing which segment you are holding. Appreciation in art has historically followed fashion, and fashion moves generationally. By Masterworks' stated estimates, Contemporary work made after 1970 has appreciated on the order of 12 to 13% a year, Modern at roughly 8 to 9%, Impressionist at 6 to 7%, and Old Masters at 1 to 2%. The older the art, the less it has appreciated, which runs against most people's intuition. Patience compounds best in the segments where appreciation is fastest and the recovery after a correction is broadest.
The PWC Index, our Post-War and Contemporary index built on repeat-sale methodology, shows the cyclicality plainly. It peaked near 23 in 2022 and fell to roughly 15 to 16 by 2025. The same index also shows how the recovery years have done the heavy lifting historically, with the strongest era returns clustered in the recoveries that followed major wealth events. Those are gains you collect only by being invested through the lean years that precede them. Past performance is not predictive, and we hold the index out as a record of what has happened, not a forecast of what will.
The Bottom Line
- Art turns over at only about 3 to 5% of its total value a year, which means the asset class is built around multi-year holds rather than active trading [3].
- A round trip through a major auction house costs 30 to 45% of a work's value, so the price must rise roughly 50% to break even, and only a long holding period brings the required annual return down to a realistic level [1].
- The illiquidity premium rises with the holding period, and in art the realized return climbs from near zero on short holds toward the index rate on holds of ten years or more [4][5].
- Past corrections have taken roughly three to five years to recover at the market level and far longer at the segment level, and the recovery is collected only by investors who held through the trough [2][6].
- Death, divorce, and debt force sales on legal and tax calendars rather than market cycles, and forced sellers consistently realize less than patient ones [7].
- Treating art as a long-term, illiquid allocation, usually under 5% of a portfolio to start, is what keeps the timing of any sale in the investor's own hands.
Sources
- Artsy Editorial. "What Art Buyers and Sellers Need to Know About Auction Fees." Artsy, November 7, 2025. https://www.artsy.net/article/artsy-editorial-art-buyers-sellers-auction-fees
- Art Basel & UBS / Arts Economics, as summarized in "How the art market has reacted to economic crises from the 20th century to now." Artshortlist, October 29, 2024. https://artshortlist.com/en/journal/article/how-the-art-market-has-reacted-to-economic-crises-from-the-20th-century-to-now
- Mercer Advisors. "Investing in Fine Art: A Guide on Risks, Returns and How to Integrate Your Collection into Your Wealth Plan." Mercer Advisors, May 21, 2026. https://www.merceradvisors.com/guide/investing-in-fine-art-a-guide-on-risks-returns-and-how-to-integrate-your-collection-into-your-wealth-plan/
- CAIA Association. "The Ins and Outs of Investing in Illiquid Assets." Alternative Investment Analyst Review, Q2 2016. https://caia.org/sites/default/files/AIAR_Q2_2016_05_InsandOuts.pdf
- Renneboog, Luc, and Christophe Spaenjers. "Buying Beauty: On Prices and Returns in the Art Market." Management Science, 2013, with related repeat-sale and hedonic studies (Mei and Moses, "Art as an Investment and the Underperformance of Masterpieces," American Economic Review, 2002). https://www.gsb.stanford.edu/insights/research-art-good-investment
- European Financial Management Association. "Art in Times of Crisis." EFMA Annual Meeting paper, 2023. https://www.efmaefm.org/0EFMAMEETINGS/EFMA%20ANNUAL%20MEETINGS/2023-UK/papers/EFMA%202023_stage-4455_question-Full%20Paper_id-72.pdf
- Artwork Archive. "Collectors: What You Need to Know About Reselling Your Art." Artwork Archive, September 20, 2022. https://www.artworkarchive.com/blog/collectors-what-you-need-to-know-about-reselling-your-art
- Axiom Fine Art. "The Collector's Guide to Fine Art Investment." Axiom Fine Art, June 10, 2025. https://axiomfineart.com/fine-art-investment-guide/
- Brookfield Private Wealth. "Illiquidity Premium." Brookfield Private Wealth Glossary, updated June 20, 2026. https://privatewealth.brookfield.com/glossary/illiquidity-premium
- CFA Institute. "Is Illiquidity a Blessing in Disguise for Some Investors?" Enterprising Investor, August 7, 2024. https://rpc.cfainstitute.org/blogs/enterprising-investor/2024/is-illiquidity-a-blessing-in-disguise-for-some-investors
- Observer. "What Sotheby's Buyer's Premium Increase Reveals About the Major Auction Market." Observer, February 19, 2026. https://observer.com/2026/02/art-sothebys-raises-buyer-premium-global-auction-market-christies-phillips/
- Artpulse Magazine. "Art Market Crisis." Artpulse Magazine, citing Artprice index data for 2008 and 2009. http://artpulsemagazine.com/art-market-crisis
- Art Basel & UBS. "The Art Market 2026," prepared by Dr. Clare McAndrew, Arts Economics, 2026 (global sales ~$59.6bn, +4%; public auction +9%). https://www.artbasel.com/about/initiatives/the-art-market
- Artnet. "Artnet Intelligence Report 2026," recovery by price band versus 2024 (over $10M +36%; $1M to $10M +21%; $100K to $1M +6%; under $100K roughly flat). https://www.artnet.com/intelligence-report-2026
Disclosures
Investing involves risk. Past results are not indicative of future outcomes.
Masterworks is providing this communication as an agent for its issuer entities, not Masterworks Advisers. This material is produced by Masterworks for informational purposes only and does not constitute investment advice, a recommendation, or an offer or solicitation to buy or sell any security. Masterworks is not a licensed broker-dealer by the SEC or FINRA.
Masterworks can only make and accept sales after an offering statement has been filed, and "qualified", by the SEC. Any offers may be revoked before notice of qualification. Indications of interest involve no obligation. For further disclosure visit the offering documents filed with the SEC and Important Disclosures at masterworks.com/cd.
Forward-looking statements and internal estimates are based on assumptions that may prove incorrect, and actual outcomes may differ materially. Figures denoted in brackets are subject to confirmation. Investing in art and alternative assets involves risk, including loss of principal.
Art sales price data is comparative only. Each painting is unique and historical data is not a direct proxy for any specific painting or investment. Data represents whole art, not an investment into our offerings which includes fees and expenses. Any comparative images are not currently live offerings and are provided for educational purposes only.
Masterworks, LLC is located at 1 World Trade Center, 57th Floor, New York, NY 10007.


