
Masterworks Research · June 2026
Why the number of art transactions keeps climbing while aggregate value stays soft, and why a broadening, more liquid market matters more to investors than the headline dollar figure.
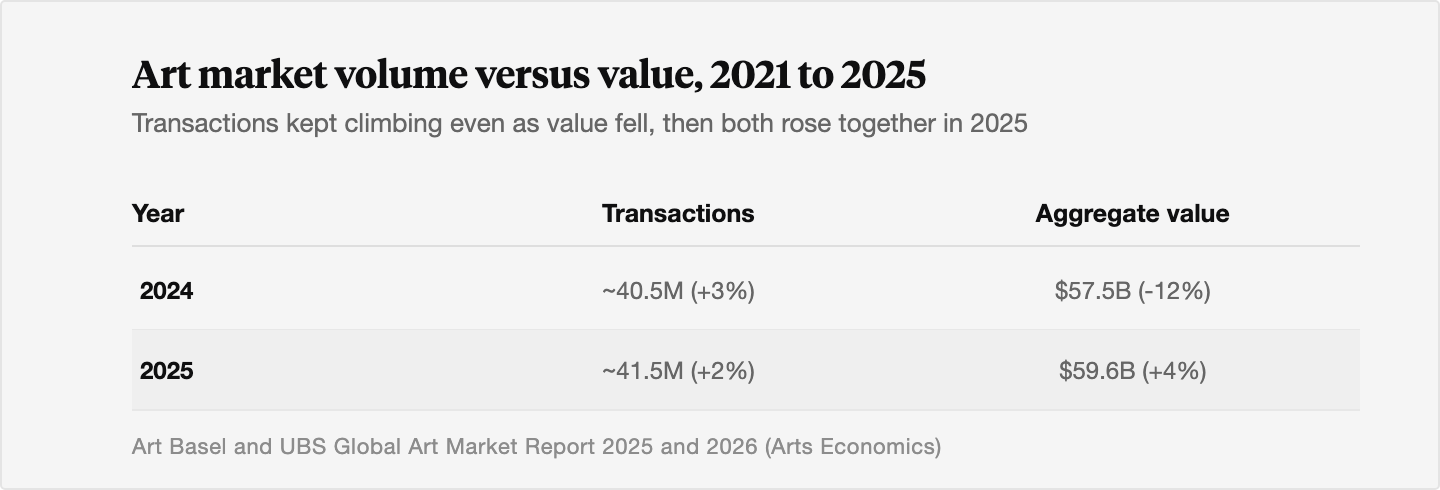
Art transaction volume has grown for four straight years while the market's total dollar value fell, because the two numbers measure different things. Volume counts how many works change hands, and that count reached an estimated 40.5 million transactions in 2024, up 3%, and roughly 41.5 million in 2025, up 2% [1][3]. Value measures the dollars those works fetched, and it fell 12% to about $57.5 billion in 2024 before recovering 4% to $59.6 billion in 2025 [1][3]. The split exists because volume growth comes from the broad base of the market, where online channels and lower-priced works are adding buyers and trades, while value is set at the very top, where a small number of seven and eight figure lots swing billions. For an investor, the volume story is the one that tends to get missed, and in our view it is the more durable signal: a market with more participants and more trades is a more liquid market, and liquidity is what makes an asset class investable.
What You Need to Know
- Volume and value have moved in opposite directions for four years. Transactions rose to about 40.5 million in 2024 (up 3%) even as total sales value fell 12% to $57.5 billion. In 2025 both rose, to roughly 41.5 million transactions and $59.6 billion [1][3].
- The high end sets the dollar number. The drop in 2024 value was driven by cooling at the top: the number of fine art works sold at auction above $10 million fell by roughly 39% [4]. A handful of trophy lots can move billions while barely touching the transaction count.
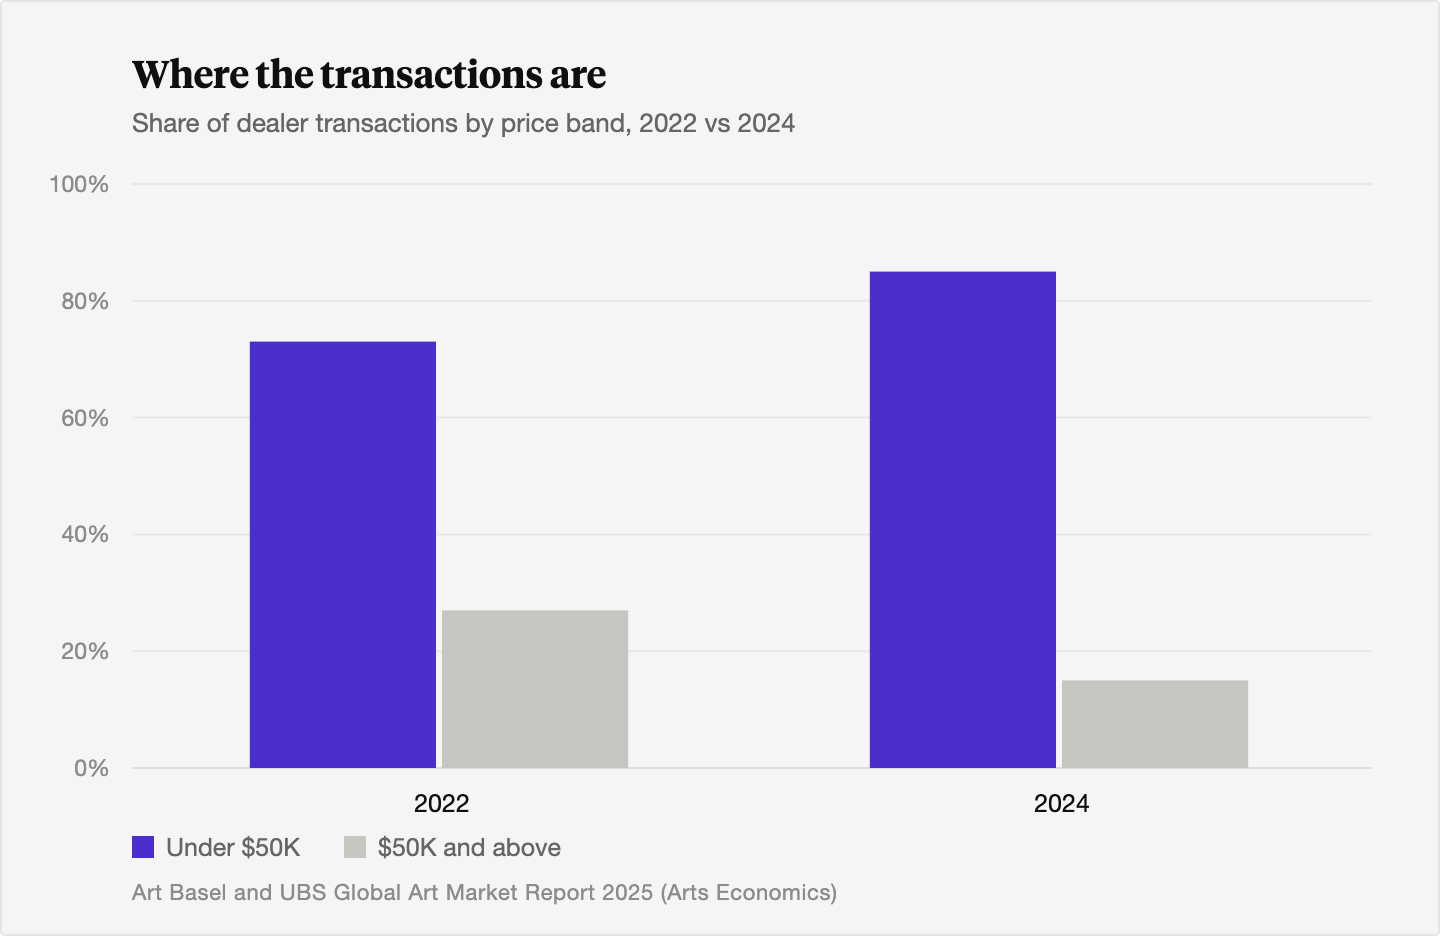
- The base sets the volume number. Works under $50,000 made up about 85% of dealer transactions in 2024, up from 73% in 2022 [4]. Auction lots under $5,000 grew, and small dealers with turnover under $250,000 reported sales growth of about 17% [5].
- Online and new buyers are the engine. The market counted an estimated 44 million buyers in 2024, and online channels lower the cost of small trades, so they multiply transactions even though online's share of value sits in the mid teens [4][5].
- More volume usually means more liquidity. More buyers, more comparable sales, and more frequent trades improve price discovery and exit potential. For a historically thin market, that broadening is a structural improvement, though it does not change the fact that art is a long-term, illiquid allocation.
1. What art transaction volume measures, and why it diverges from price
Two numbers describe the art market, and they answer different questions. Transaction volume is a count: how many individual works were bought and sold across dealers and auction houses in a year. Aggregate value is a sum: the total dollars those transactions added up to. In a market where every object is unique and prices range from a few hundred dollars to over $200 million, those two numbers do not have to move together. They have not.
The Art Basel and UBS Global Art Market Report, authored by the cultural economist Dr. Clare McAndrew, put global sales at an estimated $57.5 billion in 2024, a 12% decline year on year, while the number of transactions rose 3% to about 40.5 million [1]. In 2025 the market returned to growth, with value up 4% to $59.6 billion and volume up 2% to roughly 41.5 million [3]. So even in the recovery year, the count kept climbing on its own track.
A note on why this happens. Aggregate value is dominated by a tiny slice of the market, the works that sell for seven and eight figures. When a few of those do not come to market, or sell for less, billions of dollars vanish from the total while only a few transactions disappear from the count. Meanwhile, tens of thousands of works trading for a few thousand dollars each add almost nothing to value but a great deal to volume. The mechanism is arithmetic, and it is worth being precise about which lever each number sits on.
2. The high end drives value: why a few lots move billions
Value concentrates at the top. Works priced over $1 million account for a small fraction of the lots that sell but more than half of auction value. MyArtBroker, summarizing the 2026 report, notes that works above $1 million represent less than 0.5% of lots yet over 56% of the value of offline auction sales [7]. That concentration is why the headline dollar figure tracks the wealthiest end of the market and almost nothing else.
The 2024 contraction makes the point cleanly. McAndrew reported that the number of fine art works selling at auction above $10 million fell by roughly 39% versus 2023, and value in that ultra high end was down sharply [4]. Removing those lots subtracted billions from aggregate value while taking only a small number of transactions out of the 40.5 million total. The market did not get less active. It got less expensive at the very top.
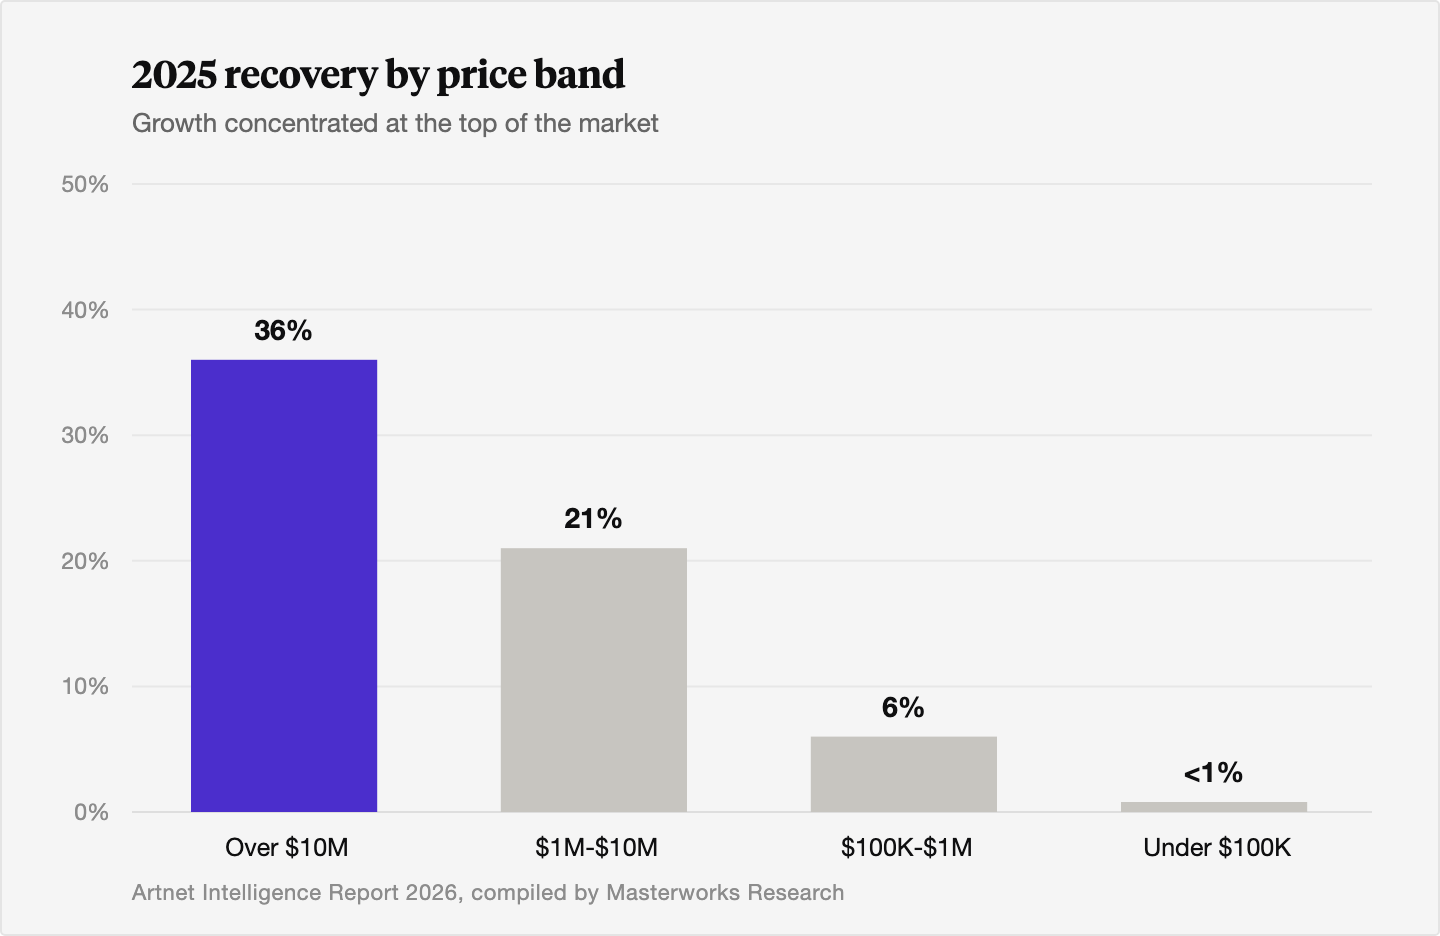
We have written before about how the top tiers behave differently from the rest of the market, and the recovery in 2025 followed the same logic in reverse. Public auction sales rose 9% to $20.7 billion, driven by ultra high end sales above $10 million, which were up about 30% in value [3]. The firm's compiled price band data from the Artnet Intelligence Report 2026 shows the recovery skewed hard to the top: works over $10 million up about 36% year on year, the $1 million to $10 million band up about 21%, the $100,000 to $1 million band up about 6%, and works under $100,000 essentially flat at under 1% [8]. The dollars came back where they always sit. For more on how each tier moves on its own clock, see our analysis of how $100K, $1M, and $10M works behave differently.
3. The base drives volume: lower price bands, online channels, more buyers
Volume comes from the other end of the market. Most transactions are small, and the small end is where the growth lives. McAndrew's data shows works priced below $50,000 made up about 85% of dealers' transactions in 2024, up from 73% in 2022 [4]. At auction, sales of fine art lots under $5,000 increased in 2024 even as overall auction value fell 25% [1][4]. The long tail of small trades got longer.
Three forces are pushing the count up. The first is online sales, which lower the search and transaction costs of selling lower priced work. The market counted an estimated 44 million buyers in 2024, with online sales around $10.5 billion that year, and online skews heavily toward lower price bands, so its share of transactions runs well above its share of value [4]. The second is the dealers who serve that base: smaller dealers with turnover under $250,000 reported annual sales growth of about 17% in 2024, the strongest part of an otherwise soft dealer sector [5]. The third is new participants. McAndrew describes a collector base expanding through younger and first time buyers who are comfortable buying online and start at modest price points, transacting more often but at smaller tickets [3][5].
Put those together and the divergence resolves itself. A 10% to 20% rise in the number of lots under $5,000 can lift the market wide transaction count by a few percent, while a modest pullback in seven and eight figure works erases billions in value and removes only a handful of trades. To understand why the auction room and the dealer floor send such different signals, see our piece on private sales versus public auctions.
4. Why rising volume matters more than the headline value number
For an investor, transaction volume is a read on liquidity, and liquidity is what separates an investable asset class from a collection of expensive objects. In a market where every work is unique and trading is naturally thin, the count of transactions is one of the few practical measures of depth, the ability to absorb buying and selling without large price distortions.
More participants improve price discovery. When more buyers and sellers are active, there are more bids, more comparable sales, and more frequent transactions, which gives an investor more signals and makes valuation less dependent on a few isolated trades. A market that trades 41.5 million times a year supports more reliable pricing than one that trades a tenth as often. The breadth is the point. To gauge how much trust to place in any single market wide number, including this one, see our guide to what art indices track and where they fall short.
We should be honest about the limits. A broadening base at the low end does not by itself make a $30 million painting easy to sell on a Tuesday. Liquidity at the very top stays selective, and the works that meet the bar for rarity and provenance trade in their own narrow lane. Rising volume is a sign of a healthier, deeper market overall. It is not a promise of a quick exit on any one work, and art remains a long term, illiquid allocation best measured in years.
5. How this fits the broader market cycle
The volume and value split is also a cycle story. Volume held up and even grew through the 2023 to 2024 correction, which is consistent with how art markets have behaved through past drawdowns: activity at the base continues while the trophy end pauses and waits. The 2025 recovery, with value up 4% and the top band leading, looks like the early innings of the top end re engaging rather than a broad surge across every tier [3].
That pattern matters for timing. A market whose volume never collapsed, and whose value is now turning up from the top, is repricing rather than seizing up. We have laid out the full anatomy of expansion, peak, correction, and recovery in our piece on how art market cycles work, and the current readings sit where you would expect early in a recovery. As always, past patterns are a guide to how the market has behaved, not a prediction of what it will do next.
The Bottom Line
- Transaction volume and aggregate value measure different things, and they have moved in opposite directions for four years because they sit on different parts of the market.
- Value is set at the top, where a roughly 39% drop in works sold above $10 million in 2024 erased billions while removing few trades, and a top heavy recovery added them back in 2025.
- Volume is set at the base, where works under $50,000 made up about 85% of dealer transactions in 2024 and online channels keep adding small trades and new buyers.
- Rising volume is a read on liquidity and market depth, which tend to improve price discovery and exit potential, though liquidity at the very top stays selective.
- A market that kept trading through the correction and is now recovering from the top is repricing in an orderly way, and art remains a long term, illiquid allocation.
Sources
- Art Basel and UBS. "The Art Basel and UBS Global Art Market Report 2025." Art Basel, April 2025. https://www.artbasel.com/news/the-art-basel-and-ubs-global-art-market-report-2025
- Artsy Editorial. "5 Key Takeaways from Art Basel and UBS's Report The Art Market 2025." Artsy, April 8, 2025. https://www.artsy.net/article/artsy-editorial-5-key-takeaways-art-basel-ubss-report-the-art-market-2025
- UBS. "The Art Basel and UBS Global Art Market Report 2026." UBS Art Market Research, April 18, 2026. https://www.ubs.com/global/en/our-firm/art/art-market-research.html
- Art Basel. "Seven critical trends that reshaped the global art market in 2024." Art Basel, April 2025. https://www.artbasel.com/stories/seven-critical-trends-that-reshaped-the-art-basel-and-ubs-global-art-market-report-2025
- Family Wealth Report. "US Remained Largest Art Market In 2025, Art Basel, UBS Report 2026." Family Wealth Report, March 17, 2026. https://www.familywealthreport.com/article.php/US-Remained-Largest-Art-Market-In-2025-%E2%80%93-Art-Basel,-UBS-Report-2026-?id=207156
- Art Basel. "The Art Basel and UBS Global Art Market Report 2026." Art Basel, June 2026. https://www.artbasel.com/stories/the-art-basel-and-ubs-global-art-market-report-2026
- MyArtBroker. "Art Basel and UBS Art Market Report 2026: Key Trends." MyArtBroker, April 1, 2026. https://www.myartbroker.com/value/articles/art-basel-ubs-art-market-report-2026
- Artnet. "Artnet Intelligence Report 2026." Artnet News, 2026. [NEEDS INTERNAL REVIEW: confirm price-band recovery figures (Over $10M +36%, $1M-$10M +21%, $100K-$1M +6%, Under $100K <1%) and exact citation URL against the Artnet Intelligence Report 2026 as compiled by Masterworks Research.]
- Arts Economics. "The Art Basel and UBS Global Art Market Report 2026 (full report)." theartmarket.artbasel.com, March 2026. https://theartmarket.artbasel.com/download/The-Art-Basel-and-UBS-Art-Market-Report-2026-by-Arts-Economics.pdf
- Art Market Studies. "ANN: The Art Basel and UBS Global Art Market Report 2026." artmarketstudies.org, March 14, 2026. https://www.artmarketstudies.org/ann-the-art-basel-and-ubs-global-art-market-report-2026/
Disclosures
Investing involves risk. Past results are not indicative of future outcomes.
Masterworks is providing this communication as an agent for its issuer entities, not Masterworks Advisers. This material is produced by Masterworks for informational purposes only and does not constitute investment advice, a recommendation, or an offer or solicitation to buy or sell any security. Masterworks is not a licensed broker-dealer by the SEC or FINRA.
Masterworks can only make and accept sales after an offering statement has been filed, and "qualified", by the SEC. Any offers may be revoked before notice of qualification. Indications of interest involve no obligation. For further disclosure visit the offering documents filed with the SEC and Important Disclosures at masterworks.com/cd.
Forward-looking statements and internal estimates are based on assumptions that may prove incorrect, and actual outcomes may differ materially. Figures denoted in brackets are subject to confirmation. Investing in art and alternative assets involves risk, including loss of principal.
Art sales price data is comparative only. Each painting is unique and historical data is not a direct proxy for any specific painting or investment. Data represents whole art, not an investment into our offerings which includes fees and expenses. Any comparative images are not currently live offerings and are provided for educational purposes only.
Masterworks, LLC is located at 1 World Trade Center, 57th Floor, New York, NY 10007.


