Masterworks Research · June 2026
The major art market indices, the three methods behind them, and the biases that flatter returns and understate risk in every one, including our own.
A handful of indices try to measure art market performance, and they fall into three families by method: repeat-sales indices that track the same work across two or more sales (Sotheby's Mei Moses, and the index we built at Masterworks), average or median price indices that summarize what changed hands in a period (Art Market Research, Artnet's per-artist medians), and basket or market-capitalization indices that weight a set of artists (the Artprice100). A fourth name investors run into, the Knight Frank Luxury Investment Index, is a composite that folds an art line into wine, watches, and classic cars. Every one of these is a useful read on direction and rough magnitude. None of them is a price you can transact at, and each carries biases that tend to flatter returns and understate risk. This article surveys the major indices, explains the methods behind them, and is candid about the limits, including the limits of our own.
What You Need to Know
- Three methods, three different numbers. Art indices split into repeat-sales (Sotheby's Mei Moses, the Masterworks indices), average or median price (Art Market Research, Artnet), and basket or market-cap (Artprice100). The same year can read differently across them because each measures something different.
- Most of the market is invisible. In 2025, roughly 58% of the estimated $59.6 billion in global art sales moved through private dealers and galleries, where prices are not disclosed [1]. Indices measure mainly the public auction minority and infer the rest.
- Repeat-sales is the most rigorous method, and we use it. Tracking the same object over time holds quality constant, the same Case-Shiller logic Shiller built for housing. It buys that rigor with a smaller, self-selected sample of works that resold publicly.
- Selection bias flatters every art return. One well-known academic correction for the decision to bring a work to auction cut the Sharpe ratio from about 0.24 to roughly 0.04 [8]. Treat headline index returns as an upper bound.
- An index is a directional read, never a transaction price. Use indices for direction and rough magnitude. They cannot price a specific painting, and past performance is not predictive of future results.
1. Why an art market index is hard to build in the first place
Building a stock index is easy by comparison. The S&P 500 prices 500 companies continuously, every trading day, on a public exchange. Art has none of that. Each work is unique, most works almost never trade, and more than half the market never shows a public price at all.
Start with the visibility problem. In 2025, global art and antiques sales were an estimated $59.6 billion, up roughly 4% on the year, according to the Art Basel and UBS Global Art Market Report 2026 [1]. Of that, public auction sales were about $20.7 billion and dealer sales were about $34.8 billion [1]. So roughly 58% of the market by value moved through dealers and galleries, where prices are private and often never disclosed. Indices are built almost entirely on the auction portion, which means most index providers are measuring a minority of the market and inferring the rest.
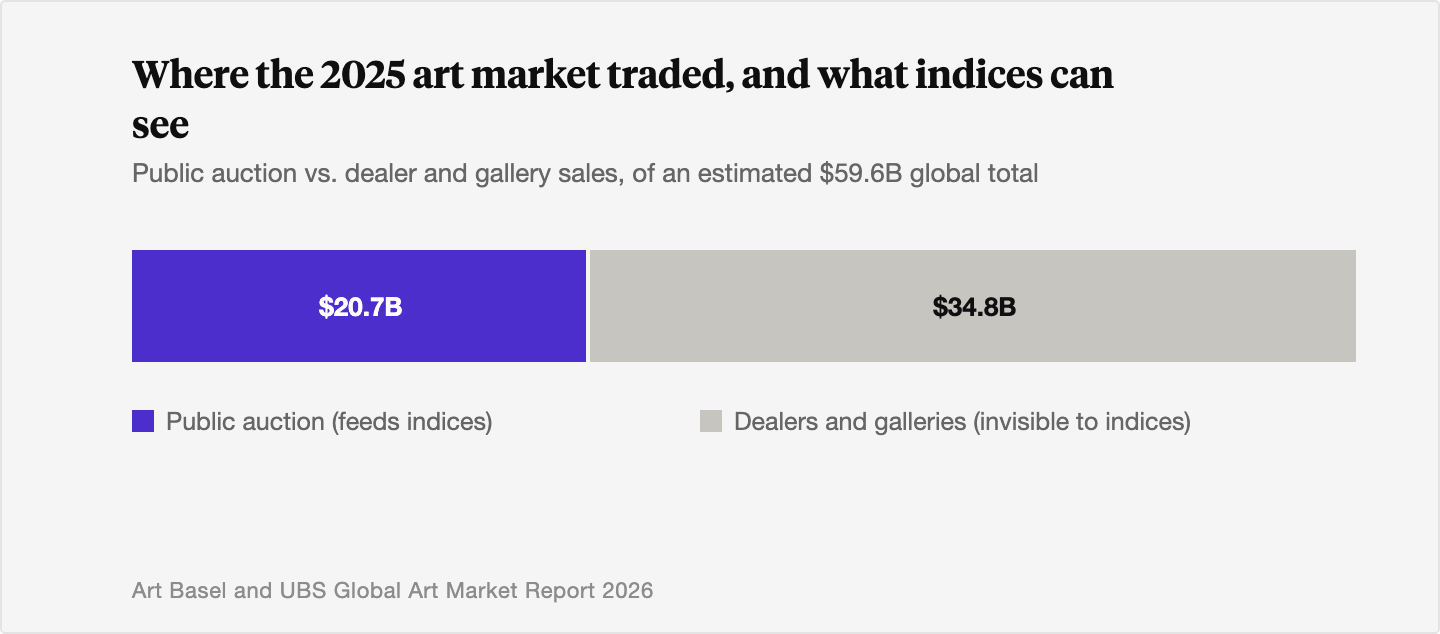
To put the split in numbers:
- Total global art and antiques sales: an estimated $59.6 billion in 2025, up roughly 4% year on year [1].
- Public auction sales: about $20.7 billion, the slice indices are mostly built on [1].
- Dealer and gallery sales: about $34.8 billion, roughly 58% of the market by value, where prices are private and rarely disclosed [1].
Then there is the trading problem. A given painting might sell once a generation. In the art market we talk about the 3 D's, death, divorce, and debt, as the usual reasons a work comes back to market, and those events are decades apart. Repeat-sales datasets used in academic work imply average holding periods well into the 10 to 20 year range [2]. An index has to draw a continuous line through points that are years apart, on objects that are each one of a kind. That is a hard estimation problem, and the choices a provider makes to solve it are where the methodologies diverge.
2. Repeat-sales, hedonic, and average-price: the three ways to build one
There are three broad methods, and the differences matter because they change what the number means.
Repeat-sales regression. You track the same object across two or more sales and measure the price change between them. This is the approach Robert Shiller used to build the Case-Shiller home price index, and it is the method behind Sotheby's Mei Moses and the index we built at Masterworks. When the same Warhol sells in 2018 and again in 2025, the change in price isolates pure appreciation, because you are comparing a thing to itself rather than averaging a basket of different things. The cost is data. You can only use works that have sold at least twice, which is a small and unusual subset of everything that trades.
Hedonic regression. You model the price of every sale as a function of its observable traits: the artist, the medium, the size, whether it is signed, which house sold it. Then you read off how the price of a standard work changed over time, holding those traits constant. The advantage is that you get to use all the sales, not just the repeats. The cost is model risk. Your index is only as good as the traits you measured, and the things that move art prices most, condition, provenance, a sudden critical reappraisal, are the hardest to put in a spreadsheet.
Average or median price. You take the average or median price of what sold in a period and chain those together. It is simple and transparent, and it is the basis for some of Art Market Research's index family and, in a per-artist form, for Artnet's indices, which compute a median price per artist and weight artists equally to damp outliers [3]. The weakness is composition. If a lot of trophy works happen to sell one year and a lot of minor works the next, the index can fall even when nothing about the underlying market changed. You are measuring the mix of what came up for sale as much as the price of art.
A useful way to hold these in mind: repeat-sales and hedonic methods both try to hold quality constant, by different routes, while average and median methods mostly do not. That single fact explains a lot of why two honest indices can disagree about the same year.
3. A tour of the major art market indices
Here is the working catalog, with what each one actually is.
Sotheby's Mei Moses. A repeat-sales index developed by professors Jianping Mei and Michael Moses in the early 2000s, acquired by Sotheby's in 2016 [4]. It draws on roughly 200 years of auction history across Sotheby's, Christie's, and Phillips, covering tens of thousands of works that have sold publicly more than once, and publishes an All Art index plus category indices [4]. Because it only uses works that resold, it is the cleanest example of the repeat-sales tradeoff: a quality-constant series built on a self-selected subset.
Artprice100 and the Artprice Global Index. Artprice, now Artmarket.com, runs a flagship Artprice100 that behaves like a market-capitalization index of the top 100 auction-performing artists, weighting higher-value artists more heavily, alongside a broader Global Index of auction prices [3]. The Artprice100 fell about 8.3% in 2024, and Artprice reported it reached a new high in 2025 while still trailing the S&P 500, which rose roughly 17% over the comparable 12 months [5]. Artprice has also published a correlation of about 0.88 between the Artprice100 and the S&P 500 since 2000 [5], which is worth pausing on, because a blue-chip art basket tracking equities that closely is a different story than the zero-correlation pitch art often gets.
Art Market Research (AMR). One of the oldest commercial providers, with index families dating to the 1980s, generally built on average and median auction prices by category and artist [3]. Useful for long historical series, subject to the composition effect that comes with average-price methods.
Artnet Indices. Built on the Artnet Price Database, which covers more than 1,800 auction houses and auction data back to 1985 [3]. Artnet's method takes a median price per artist and weights artists equally, which dampens the effect of a single outlier sale [3]. Auction-only, like the rest.
Knight Frank Luxury Investment Index (KFLII). Not an art index proper. It is a composite of passion assets, art alongside wine, watches, classic cars, and jewelry, published each year in the Knight Frank Wealth Report. The full index was down 0.4% in 2025 and up 38.6% over the decade [6]. Its art read for 2025 was strong: fine art across the major houses rose about 11% year on year, with Impressionist works up 80.4% on the back of a few large single-owner sales [6]. Treat the art line as a derived, category-level read, not a transaction-level index.
The Masterworks indices. We publish an All Art index and a Post-War and Contemporary index. At a public level, we build them using a repeat-sales methodology, the same Case-Shiller logic Shiller used for housing, on the segment we focus on. We will hold our own index to the same scrutiny as the rest of this list in the next two sections, because it is subject to the same biases.
One named example anchors why all of this matters right now. In November 2025, Gustav Klimt's Bildnis Elisabeth Lederer sold at Sotheby's for $236.4 million, the highest price ever paid for a modern work at auction and the second most expensive work of art ever sold at auction, behind the $450.3 million paid for Leonardo's Salvator Mundi in 2017 [7]. A single sale like that can move a top-100 basket index, barely register in a broad average, and never touch a repeat-sales index at all if the work had not sold publicly before. Same market, same week, three different index readings. That is the catalog problem in one painting.
4. The limitations every art index shares
This is the part that matters most, and it applies to our index as much as anyone's. Five problems sit underneath all of them.
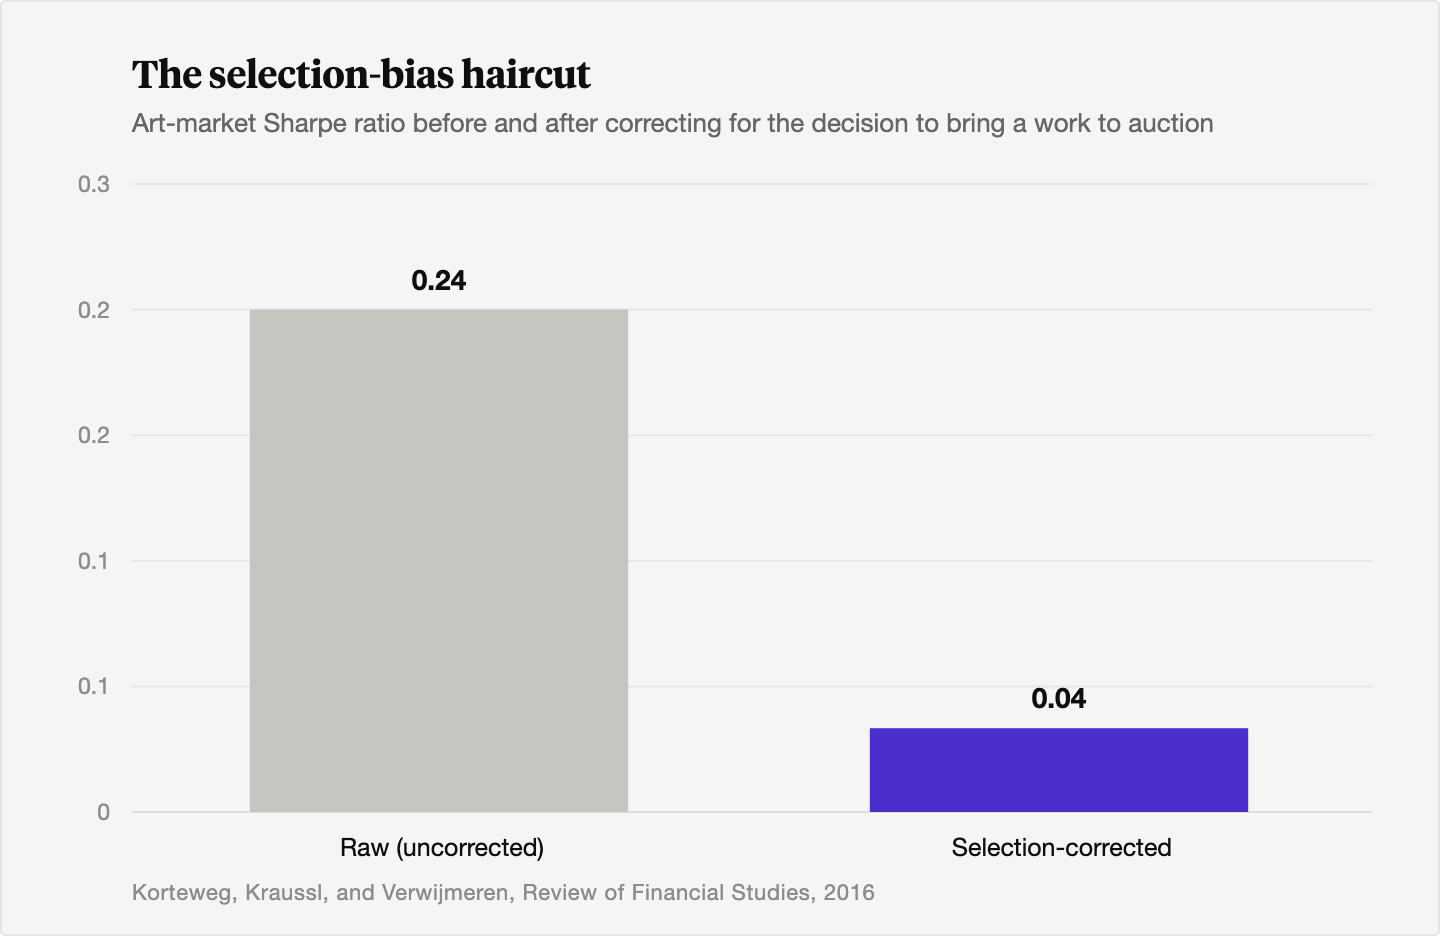
Selection and survivorship bias. Owners choose when to sell, and they tend to sell winners into strength and quietly hold or privately offload losers. Works that fail to meet reserve, the bought-in lots, often drop out of the data entirely. The academic correction for this is large. Korteweg, Kraussl, and Verwijmeren, writing in the Review of Financial Studies in 2016, modeled the decision to bring a work to auction and found that correcting for it cut estimated art returns materially and collapsed the risk-adjusted performance, with the Sharpe ratio in the related work falling from about 0.24 to roughly 0.04 once selection was accounted for [8]. Most of the apparent free lunch turned out to be selection at work rather than real return.
Infrequent trading. The whole market did about $59.6 billion across an entire year in 2025 [1]. A single large-cap stock can trade more than that in a day. With trades this sparse, an index is interpolating across long gaps, and the line it draws is smoother and more confident-looking than the underlying reality.
Appraisal lag and smoothing. Because real trades are rare, illiquid-asset indices tend to understate volatility and overstate steadiness, the same way appraisal-based real estate and private equity indices do. In those better-studied markets, de-smoothing the data typically reveals true volatility 1.5 to 3 times higher than the reported figure [2]. We do not have a clean published de-smoothing of every art index, but the mechanism is identical, so the honest read is that art index volatility is probably higher than it looks, and correlations to stocks are probably higher too. This is why we treat the headline volatility of any art series, ours included, with suspicion.
Heterogeneity. Every work is unique, so a 5% move in any art index does not mean a specific painting on a wall is worth 5% more. Condition, provenance, and shifting taste swamp the index signal at the level of an individual object. The relationship between an art index and a single work is far looser than the relationship between the S&P 500 and a diversified stock portfolio.
No dividends, and costs the index ignores. Art pays no yield. Every published return is gross price appreciation, with nothing taken out for insurance, storage, shipping, conservation, or the auction commissions that can run well into double digits of the transaction. Equity indices are usually quoted as total return, dividends included. Comparing a gross, cost-free art index to a net-of-nothing stock index is not apples to apples, and the gap runs against art.
We will say plainly where this lands for our own index. A repeat-sales method is the most rigorous of the three, which is why we use it, and it is still exposed to selection: it can only see works that resold publicly, in the segment we chose to track, at the houses that report. We think it is a good estimate of direction and rough magnitude in Post-War and Contemporary art. We do not think it is a guarantee, a transaction price, or free of the biases above.
5. How to read an art index as an investor
So what is an art index good for. Direction and rough magnitude. It can tell you the market is recovering, or that the top is leading the rebound, which is the actual shape of the current cycle. Growth in 2025 was concentrated at the high end, with fine art lots over $1 million up about 21% in value and works over $10 million up about 30%, while the broad market rose a more modest 4% [1]. An index captures that the recovery is real and uneven. That is a genuinely useful read.
What an index cannot do is set a price for your work. It is a market-level average, not a quote. The history of the field is a long argument about exactly how much indices overstate returns. Goetzmann, working with three centuries of auction data in a 1993 American Economic Review paper, found art's real returns positive but modest and below equities over the long run [9]. Mei and Moses, in the 2002 American Economic Review paper that gave the index its name, documented that the most expensive works, the masterpieces, actually underperformed the broader art index by roughly one to two percentage points a year [10]. The whole literature points the same direction: read art indices as descriptive, haircut the return, inflate the volatility, and assume a long holding period and no income.
Past performance is not predictive. Every figure here is history, and history in a thinly traded market with the biases above is a noisier guide than it looks. Use indices to understand the terrain. Do not use them to underwrite a number.
The Bottom Line
- Art market indices come in three methods: repeat-sales (Sotheby's Mei Moses, the Masterworks indices), average or median price (Art Market Research, Artnet), and basket or market-cap (Artprice100). The Knight Frank Luxury Investment Index is a composite that includes art alongside other passion assets.
- Repeat-sales is the most rigorous method because it tracks the same object over time and holds quality constant, the same way Case-Shiller tracks home prices. It buys that rigor with a smaller, self-selected sample of works that resold publicly.
- Every art index shares five limits: selection and survivorship bias that flatters returns, infrequent trading, appraisal smoothing that understates volatility, the heterogeneity of unique objects, and the absence of any dividend or income. These apply to the Masterworks index as much as to any other.
- Most of the market is invisible to indices. In 2025, roughly 58% of the estimated $59.6 billion in global art sales moved through private dealers and galleries, where prices are not disclosed. Indices measure mainly the public auction minority.
- Academic work that corrects for selection bias finds materially lower art returns and a near-zero risk-adjusted edge, with one well-known correction cutting the Sharpe ratio from about 0.24 to 0.04. Treat headline index returns as an upper bound.
- An index tells you direction and rough magnitude. It is not a price you can transact at, and past performance is not predictive of future results.
Sources
- Art Basel and UBS. "The Art Basel and UBS Global Art Market Report 2026." Art Basel, 2026. https://www.artbasel.com/stories/the-art-basel-and-ubs-global-art-market-report-2026
- Korteweg, Arthur, Roman Kraussl, and Patrick Verwijmeren. "Does It Pay to Invest in Art? A Selection-Corrected Returns Perspective." Working paper, Stanford Graduate School of Business, 2016. https://www.gsb.stanford.edu/faculty-research/working-papers/does-it-pay-invest-art-selection-corrected-returns-perspective
- Morgan Stanley. "How Are Art Market Indexes Calculated?" Morgan Stanley, 2023. https://www.morganstanley.com/articles/art-market-indexes
- Sotheby's. "Sotheby's Acquires the Mei Moses Art Indices." Sotheby's, 2016. https://www.sothebys.com/en/articles/sothebys-acquires-the-mei-moses-art-indices
- Econique / Artprice. "Artprice100 Index Grows in 2025 and Strengthens the Connection With the Stock Market." Econique, 2025. https://econique.art/en/artprice100-index-grows-in-2025-and-strengthens-the-connection-with-the-stock-market/
- Knight Frank. "Knight Frank Luxury Investment Index: Luxury Holds Steady." Knight Frank Research, April 23, 2026. https://www.knightfrank.com/research/article/2026/4/knight-frank-luxury-investment-index-luxury-holds-steady
- ARTnews. "Gustav Klimt's 'Portrait of Elisabeth Lederer' Sells for $236.4 M., Highest Price for Any Work of Modern Art Sold at Auction." ARTnews, November 18, 2025. https://www.artnews.com/art-news/news/gustav-klimt-portrait-of-elisabeth-lederer-auction-record-1234762083/
- Korteweg, Arthur, Roman Kraussl, and Patrick Verwijmeren. "Does It Pay to Invest in Art? A Selection-Corrected Returns Perspective." Review of Financial Studies 29, no. 4 (2016): 1007-1038. https://academic.oup.com/rfs/article-abstract/29/4/1007/1605186
- Goetzmann, William N. "Accounting for Taste: Art and the Financial Markets over Three Centuries." American Economic Review 83, no. 5 (1993): 1370-1376. https://www.jstor.org/stable/2117565
- Mei, Jianping, and Michael Moses. "Art as an Investment and the Underperformance of Masterpieces." American Economic Review 92, no. 5 (2002): 1656-1668. https://www.jstor.org/stable/3083271
- Goetzmann, William N., Luc Renneboog, and Christophe Spaenjers, et al. "Selection bias in art price data." Working paper version, EconStor. https://www.econstor.eu/bitstream/10419/25546/1/577545752.PDF
- Critical Edge. "Why Art Market Indexes Are Problematic." Critical Edge, 2024. https://www.criticaledge.art/p/why-art-market-indexes-are-problematic
- MyArtBroker. "Decoding Art Indices: MAB100 and Traditional Resources." MyArtBroker, 2024. https://www.myartbroker.com/art-and-tech/articles/decoding-art-indices-mab100-and-traditional-resources
- Art Basel and UBS. "The Art Basel and UBS Art Market Report 2025." Arts Economics, 2025. https://theartmarket.artbasel.com/the-art-market-2025/global-market
Related Reading
- Appraisal Lag: Why Art Valuations Are Always Looking Backward
- Comparable Sales Analysis for Art: How Appraisers Build Price Estimates
- What Auction Estimates Reveal About Market Direction
- Open Data Initiatives in Art: Who's Publishing What, and Why It Matters
Disclosures
Investing involves risk. Past results are not indicative of future outcomes.
Masterworks is providing this communication as an agent for its issuer entities, not Masterworks Advisers. This material is produced by Masterworks for informational purposes only and does not constitute investment advice, a recommendation, or an offer or solicitation to buy or sell any security. Masterworks is not a licensed broker-dealer by the SEC or FINRA.
Masterworks can only make and accept sales after an offering statement has been filed, and "qualified", by the SEC. Any offers may be revoked before notice of qualification. Indications of interest involve no obligation. For further disclosure visit the offering documents filed with the SEC and Important Disclosures at masterworks.com/cd.
Forward-looking statements and internal estimates are based on assumptions that may prove incorrect, and actual outcomes may differ materially. Figures denoted in brackets are subject to confirmation. Investing in art and alternative assets involves risk, including loss of principal.
Art sales price data is comparative only. Each painting is unique and historical data is not a direct proxy for any specific painting or investment. Data represents whole art, not an investment into our offerings which includes fees and expenses. Any comparative images are not currently live offerings and are provided for educational purposes only.
Masterworks, LLC is located at 1 World Trade Center, 57th Floor, New York, NY 10007.