
Masterworks Research · June 2026
Why combining assets that move to different rhythms is the one place in markets you get something for nothing, and why that benefit thins out in the moments you need it most.
Diversification is called the only free lunch in investing because combining assets that do not move in lockstep lowers a portfolio's volatility without forcing you to give up expected return. Harry Markowitz showed the math for this in 1952, and the result is close to a free gift: most ways of improving a portfolio cost you something, either return or liquidity, but diversification across genuinely independent return streams reduces risk at no cost to expected return [1][2]. The catch, and it is a serious one, is that the correlations the math depends on are not stable. They tend to rise toward 1 in a crisis, which is the one moment a diversified portfolio is supposed to protect you [3][4]. For investors, this matters because it sets a precise bar for what a real diversifier has to do, and it explains why allocators keep hunting for return streams that march to their own clock.
What You Need to Know
- The free lunch is real and it comes from one number. Markowitz proved that a portfolio's risk depends not just on each asset's own volatility but on how the assets move together, measured by correlation. Mix assets with low or negative correlation and the portfolio's risk falls below the weighted average of its parts, with no required cut to expected return [1][5].
- Correlation runs from minus 1 to plus 1. At plus 1, two assets move in perfect step and you get no diversification. At 0, they move independently. At minus 1, they move in exact opposition. The diversification benefit grows as correlation falls, and anything below plus 1 helps at least a little [5].
- The benefit is largest exactly where the math gets fragile. In the 2008 crisis, pairwise correlations among equities jumped from roughly 40% to nearly 70% and stayed elevated for years [3]. In March 2020, even gold fell about 12% over ten days as investors sold whatever was liquid to raise cash [6][7]. Diversification thinned out at the worst possible time.
- Diversification and hedging are different jobs. A hedge is built to gain when a specific risk hits. A diversifier is an asset largely indifferent to the forces driving the rest of your book. The first is targeted insurance with a cost. The second is a structural property you want across many states of the world [4].
- Genuinely uncorrelated return streams are scarce, which is why allocators pay attention to them. Blue-chip art is one candidate. Citi has measured contemporary art's correlation with developed-market equities at about -0.04 over a multi-decade window, near zero [8]. That is a reason it draws interest at a small portfolio weight, with real caveats we set out below.
1. What "the only free lunch" actually means
In 1952 a 25-year-old graduate student named Harry Markowitz published a 14-page paper called "Portfolio Selection" in the Journal of Finance [1]. It founded what we now call modern portfolio theory, and it earned him a share of the 1990 Nobel Prize in economics. The core idea is plain once you see it. Before Markowitz, an investor's instinct was to pick the assets with the highest expected return. He showed that this is the wrong unit of analysis. What matters is the portfolio, and specifically how the holdings inside it move in relation to one another [5].
The phrase "the only free lunch in investing," widely attributed to Markowitz, captures why this is more than an accounting trick [2]. In most of finance you pay for what you get. Want more expected return, you take on more risk. Want more liquidity, you usually accept a lower yield. Diversification is the rare case where you can lower one thing, portfolio risk, without being charged in the currency that normally matters, expected return. You hold the same assets, in different proportions, and the combination is steadier than its pieces. That is the free lunch.
A note on how we know this. The result is not a market observation that might or might not repeat. It falls straight out of the algebra of combining imperfectly correlated random variables, which is why it has held for seventy years and across every asset class anyone has tested [2][5]. The mechanism is in the next section.
2. The correlation coefficient, from minus 1 to plus 1
Correlation is a single number that summarizes how two assets move together. It is scaled to sit between minus 1 and plus 1, and every level on that scale means something specific for a portfolio.
A correlation of plus 1 is perfect positive correlation. The two assets rise and fall in exact proportion. Holding both gives you no diversification at all, because they are, for risk purposes, the same asset wearing two labels. A correlation of 0 means the two move independently, with no systematic relationship. A correlation of minus 1 is perfect negative correlation, the assets move in exact opposition, and in theory a precise blend of two such assets could remove volatility almost entirely. Most real-world pairs sit somewhere in between, often in the 0.3 to 0.8 range for assets that share economic drivers.
The number to internalize is this: any correlation below plus 1 delivers some diversification benefit [5]. You do not need negative correlation. You do not even need low correlation. You just need the assets to be less than perfectly synchronized, and the lower the correlation, the larger the benefit. That single fact is what makes diversification available to ordinary portfolios, not just to investors who can find rare assets that move opposite to stocks.
3. The simple math of why this works
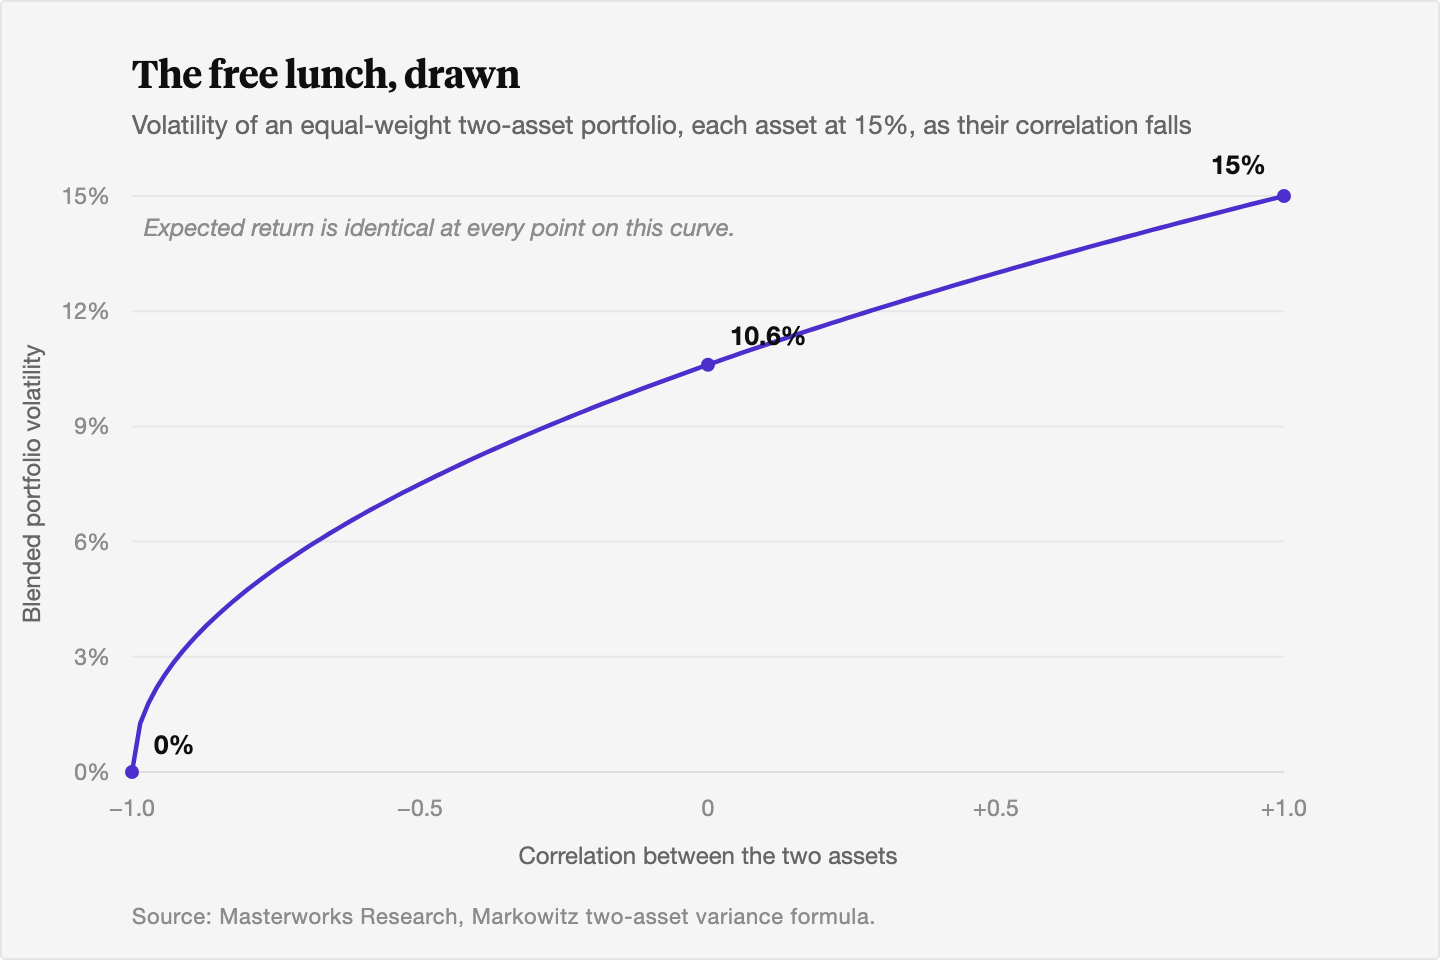
Here is the mechanism, with round numbers. Imagine two assets, A and B, each with the same expected return and the same volatility, say 15%. If you hold them in equal weight, your expected return is unchanged at the average of the two. Your risk, though, depends entirely on their correlation.
If A and B are perfectly correlated at plus 1, the blended volatility stays at 15%. You gained nothing. If they are uncorrelated at 0, the blended volatility drops to about 10.6%, a reduction of roughly a third, for free, with the same expected return. If they were perfectly negatively correlated at minus 1, the blend could in principle reach zero volatility. Same expected return in all three cases. Only the correlation changed, and only the risk moved.
The reason is that portfolio variance is not the average of the individual variances. It includes a covariance term that captures the co-movement between holdings, and that term shrinks, or even goes negative, as correlation falls [5]. The CFA Institute frames the scaling cleanly: for a portfolio of N assets there are N individual variance terms but on the order of N-squared covariance terms, so as you add holdings, the co-movement between them comes to dominate total risk [5]. A volatile asset can lower a portfolio's overall risk if it moves against what you already own. The asset's own riskiness is almost beside the point. Its relationship to the rest of the book is what counts.
4. Why low- and negative-correlation assets are worth hunting for
If any correlation below plus 1 helps, why do allocators obsess over the assets with the lowest correlation to equities? Because most portfolios are dominated by one risk. For a typical investor, that risk is the stock market. Bonds help, real estate helps, but many of the assets people reach for still carry meaningful equity beta, so they cushion a sell-off rather than sit out of it.
The prize is an asset whose return is largely indifferent to the forces driving the equity market. Add even a modest weight of it and the efficient set of portfolios available to you improves, a point we work through in detail in the efficient frontier. A low-correlation asset with a middling expected return can improve a portfolio more than a high-return asset that is tightly tied to stocks, because the second one stacks return and risk together while the first one adds return and independence. That is the whole case for a diversifier, and it is the formal backbone of modern portfolio theory.
The translation into investing terms is direct. A return stream that does not fall when equities fall shortens and shallows a portfolio's worst stretches. We took that loss-side view apart with the numbers in art's impact on portfolio drawdowns. The frontier is the theory. The drawdown record is what the theory looks like in a year you would rather forget.
5. The crucial caveat: correlations rise in a crisis
Now the hard part, and the reason we will not oversell any of the above. The correlations that diversification depends on are not fixed. They tend to climb toward 1 in exactly the conditions a diversified portfolio is built to survive.
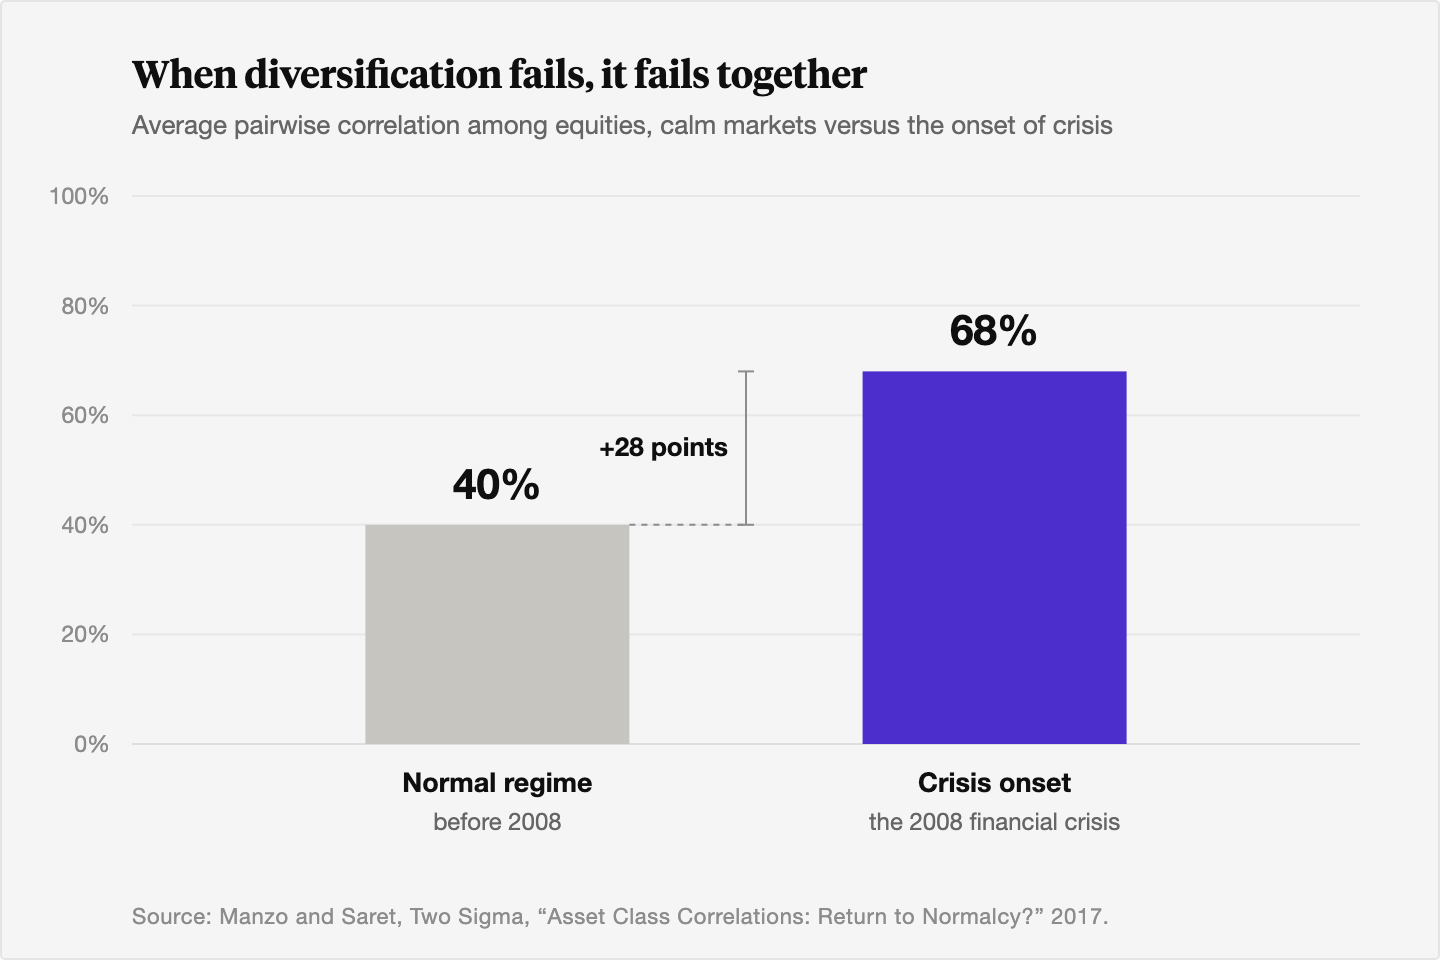
The 2008 financial crisis is the textbook case. Two Sigma researchers documented pairwise correlations among equities jumping from roughly 40% before the crisis to nearly 70% at its onset, then sitting near that elevated level for more than five years [3]. Assets that had behaved independently in calm markets started moving as one. Research published in the Financial Analysts Journal under the title "When Diversification Fails" found the same effect across a wide set of assets, with correlations spiking precisely in the left tail, the down-market scenarios where investors most need the diversification to hold [4].
March 2020 was faster and, in one respect, starker. As COVID-19 spread, the selling was not confined to risky assets. In the scramble the New York Fed later called a global "dash for cash," investors sold whatever was liquid to raise dollars, and even gold, the classic safe haven, fell about 12% over roughly ten days as borrowed positions met margin calls [6][7]. For a stretch of that month, the diversification benefit nearly vanished. Almost everything went down together.
This is the single most important thing to understand about diversification. Its benefit is largest in normal times and thinnest in the panics where you would value it most. We do not have a clean fix for this. We think the honest response is to choose diversifiers whose independence comes from their structure rather than from a quiet correlation reading taken in calm years, and to size every diversifier with the crisis case in mind, not the average year.
6. Diversification is not the same as hedging
These two words get used as if they mean the same thing. They do different jobs, and conflating them leads to disappointment.
A hedge is built to gain when a specific risk shows up. A put option on the S&P 500 is a hedge against an equity drawdown. It is designed to pay off in that exact scenario, and like most insurance, it carries an ongoing cost in the form of the premium you pay whether or not the bad event arrives. A hedge is targeted, intentional, and rarely free.
A diversifier is a different thing. It is an asset largely indifferent to the force you are worried about, so it tends to hold its own while that force plays out, without being engineered to spike when the risk hits. Real diversification means owning something that moves to its own rhythm, driven by its own supply and demand. An asset that reliably rises whenever stocks fall would be a hedge, and a valuable one. A diversifier asks for less and is more durable, because you are not paying a standing premium for it and you are not betting on one scenario. The two tools can both belong in a portfolio. They are answers to different questions, and an investor should know which one a given holding actually is.
7. How investors seek genuinely uncorrelated return streams
Once you accept that calm-market correlation can flatter an asset, the search narrows to return streams whose independence has a structural source. The question stops being "what was the correlation number last year" and becomes "why would this asset behave differently, and would that reason survive a panic."
Some candidates earn the label and some do not. Many "alternatives" turn out to carry hidden equity beta that only shows up under stress, which is the lesson of 2008. The assets that hold up tend to be the ones with a different demand base, a different liquidity profile, or a different clock. The trade-off is usually illiquidity. The return streams least tied to public markets are often the hardest to sell quickly, and that illiquidity is part of why they stay independent. It is also a real risk, not a free perk.
This is the practical version of the free-lunch idea. The lunch is free in the sense that lower correlation lowers risk at no cost to expected return. It is not free in the sense that the genuinely uncorrelated assets tend to be illiquid, harder to value, and slower to enter and exit. Investors weigh that trade every time they reach past stocks and bonds for something that marches to its own beat.
8. Where blue-chip art fits, honestly
Blue-chip art is one candidate for that role, and it draws interest from allocators for a specific reason: its historical correlation with equities has been low. Citi's art market research has measured contemporary art's correlation with developed-market equities at about -0.04 over a multi-decade window, near zero, and its correlation with investment-grade fixed income at about 0.15 [8]. The economic reason is structural. Prices at the top of the art market are driven by wealth creation among the very wealthy and by a supply of important works that does not grow, forces that have little to do with the quarterly earnings cycle that moves stocks.
We want to be precise about what that does and does not mean. Low correlation is not zero risk. Art is illiquid, with holding periods measured in years, and it cannot be sold in a morning the way a stock can. The return data has real limitations: art indices are built from repeat sales and can carry selection effects, so measured volatility and correlation should be read as estimates, not precision instruments. And correlations can shift. The same crisis dynamics that lift equity correlations toward 1 can touch any asset that has to be sold for cash, as March 2020 reminded every market.
So we frame art the way the math frames any diversifier. It is one potential source of independence among several, attractive at a small weight for the same reason any low-correlation asset is attractive, capable of improving a portfolio's risk-adjusted profile without a required cut to expected return, and subject to its own risks that an investor should weigh directly. It is not a guaranteed hedge, and we would not present it as one. For the advisor-facing version of how to size and frame that sleeve, see our piece on art as an alternative allocation.
The Bottom Line
- Diversification is called the only free lunch because mixing assets that move to different rhythms lowers portfolio risk without a required cut to expected return, a result Markowitz proved in 1952.
- Correlation runs from minus 1 to plus 1, and any reading below plus 1 delivers some benefit. The lower the correlation, the larger the reduction in portfolio volatility.
- The benefit is largest in calm markets and thinnest in crises. In 2008, equity correlations rose from about 40% to nearly 70%, and in March 2020 even gold fell as investors raised cash.
- Hedging and diversification are different jobs. A hedge is targeted insurance with a cost. A diversifier is an asset indifferent to the force you are worried about.
- Genuinely uncorrelated return streams are scarce and usually illiquid. Blue-chip art is one candidate, with a near-zero historical correlation to equities, real illiquidity, data limitations, and no guarantee that the correlation holds in every state of the world.
Sources
- Markowitz, Harry. "Portfolio Selection." The Journal of Finance, vol. 7, no. 1, March 1952, pp. 77 to 91. https://onlinelibrary.wiley.com/doi/abs/10.1111/j.1540-6261.1952.tb01525.x
- Research Affiliates. "The Only Free Lunch in Investing." Advisor Perspectives, March 14, 2024. https://www.advisorperspectives.com/commentaries/2024/03/14/only-free-lunch-in-investing
- Manzo, Gerardo, and Jeffrey N. Saret. "Asset Class Correlations: Return to Normalcy?" Two Sigma, February 15, 2017. https://www.twosigma.com/articles/asset-class-correlations-return-to-normalcy/
- Page, Sebastien, and Robert A. Panariello. "When Diversification Fails." Financial Analysts Journal, vol. 74, no. 3, 2018. https://www.tandfonline.com/doi/full/10.2469/faj.v74.n3.3
- Schafer, Brian L. "Diversification: The Only (Almost) Free Lunch in Investing." Greenleaf Trust, May 6, 2024. https://greenleaftrust.com/news/diversification-the-only-almost-free-lunch-in-investing/
- Federal Reserve Bank of New York. "The Global Dash for Cash in March 2020." Liberty Street Economics, July 2022. https://libertystreeteconomics.newyorkfed.org/2022/07/the-global-dash-for-cash-in-march-2020/
- Man Group. "Covid Crash Risk: What's in a Number?" Man Group Insights, 2020. https://www.man.com/insights/covid-crash-risk
- Citi Private Bank. "Global Art Market Disruption: Pushing the Boundaries." Citi Global Perspectives and Solutions, 2022. https://www.privatebank.citibank.com/newcpb-media/media/documents/Global-Art-Market-Disruption-Pushing-the-Boundaries.pdf
- Markowitz, Harry. "Portfolio Selection." Reference record, Journal of Finance, 1952. https://ideas.repec.org/a/bla/jfinan/v7y1952i1p77-91.html
- The Evidence-Based Investor. "Lessons in Life and Investing from the Late Harry Markowitz." 2023. https://www.evidenceinvestor.com/post/lessons-in-life-and-investing-from-the-late-harry-markowitz
- Federal Reserve Bank of New York. "The Global Dash for Cash: Why Sovereign Wealth Funds and Central Banks Sold U.S. Treasuries." Liberty Street Economics, July 2022. https://libertystreeteconomics.newyorkfed.org/2022/07/the-global-dash-for-cash-why-sovereign-wealth-funds-and-central-banks-sold-us-treasuries-in-march-2020/
- ScienceDirect. "Analysing Art as a Safe-Haven Asset in Times of Crisis." International Review of Financial Analysis, 2025. https://www.sciencedirect.com/science/article/pii/S1057521925002819
Disclosures
Investing involves risk. Past results are not indicative of future outcomes.
Masterworks is providing this communication as an agent for its issuer entities, not Masterworks Advisers. This material is produced by Masterworks for informational purposes only and does not constitute investment advice, a recommendation, or an offer or solicitation to buy or sell any security. Masterworks is not a licensed broker-dealer by the SEC or FINRA.
Masterworks can only make and accept sales after an offering statement has been filed, and "qualified", by the SEC. Any offers may be revoked before notice of qualification. Indications of interest involve no obligation. For further disclosure visit the offering documents filed with the SEC and Important Disclosures at masterworks.com/cd.
Forward-looking statements and internal estimates are based on assumptions that may prove incorrect, and actual outcomes may differ materially. Figures denoted in brackets are subject to confirmation. Investing in art and alternative assets involves risk, including loss of principal.
Art sales price data is comparative only. Each painting is unique and historical data is not a direct proxy for any specific painting or investment. Data represents whole art, not an investment into our offerings which includes fees and expenses. Any comparative images are not currently live offerings and are provided for educational purposes only.
Masterworks, LLC is located at 1 World Trade Center, 57th Floor, New York, NY 10007.


