
Masterworks Research · June 2026
What a defensible art allocation looks like once you correct the returns, size the sleeve honestly, and price in the costs.
Fine art can play a small role in a diversified portfolio as a long-term, illiquid real asset with low correlation to equities, but the case has to be built on honest numbers rather than headline index returns. After correcting for the selection bias baked into standard repeat-sales indices, the academic estimate for broad fine art is roughly 6.3% nominal a year with a Sharpe ratio near 0.11, well below equities on a risk-adjusted basis [1]. For an advisor, the practical question is not whether art "beats stocks." It is whether a small, patient allocation, sized well under 5% to start and held for 3 to 10 years, earns its place once you account for illiquidity, fees, the absence of yield, and the gap between marketed returns and what a client actually realizes. This paper lays out that case and its limits in equal measure.
What You Need to Know
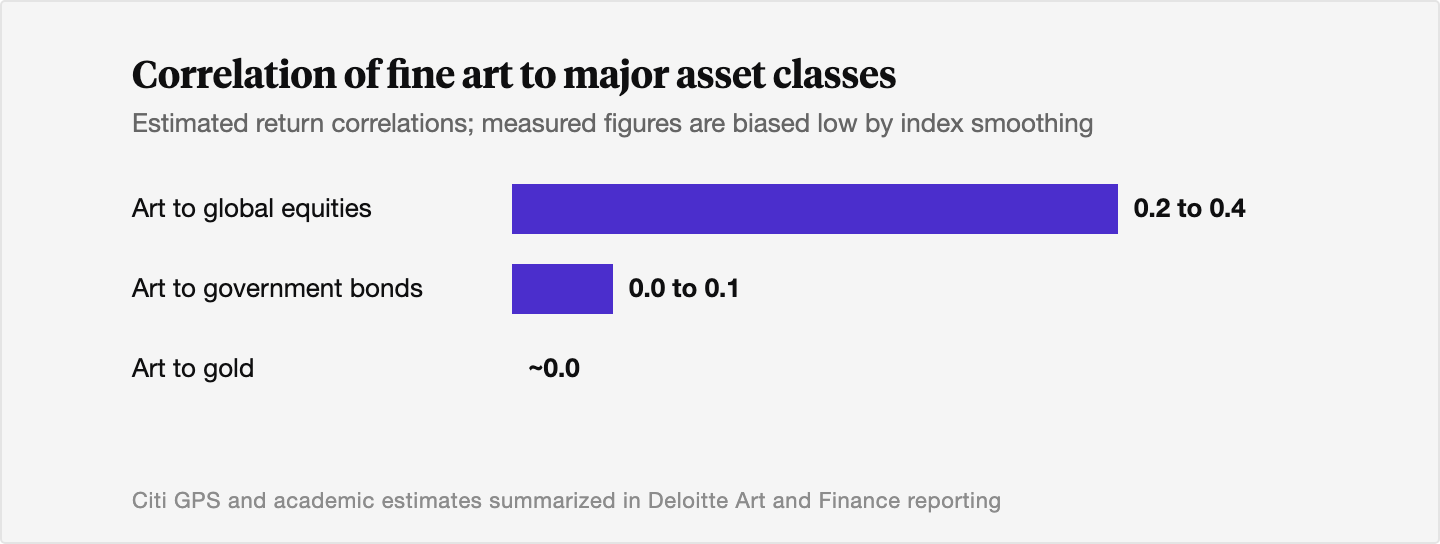
- The diversification claim is directionally real and quantitatively softer than the marketing. Peer-reviewed estimates put art's correlation to global equities around 0.2 to 0.4 and its correlation to bonds and gold near zero, not the "near-zero to equities" figure often quoted [3]. Appraisal smoothing and infrequent trading bias measured correlation downward, so we use a conservative input of roughly 0.3 to equities.
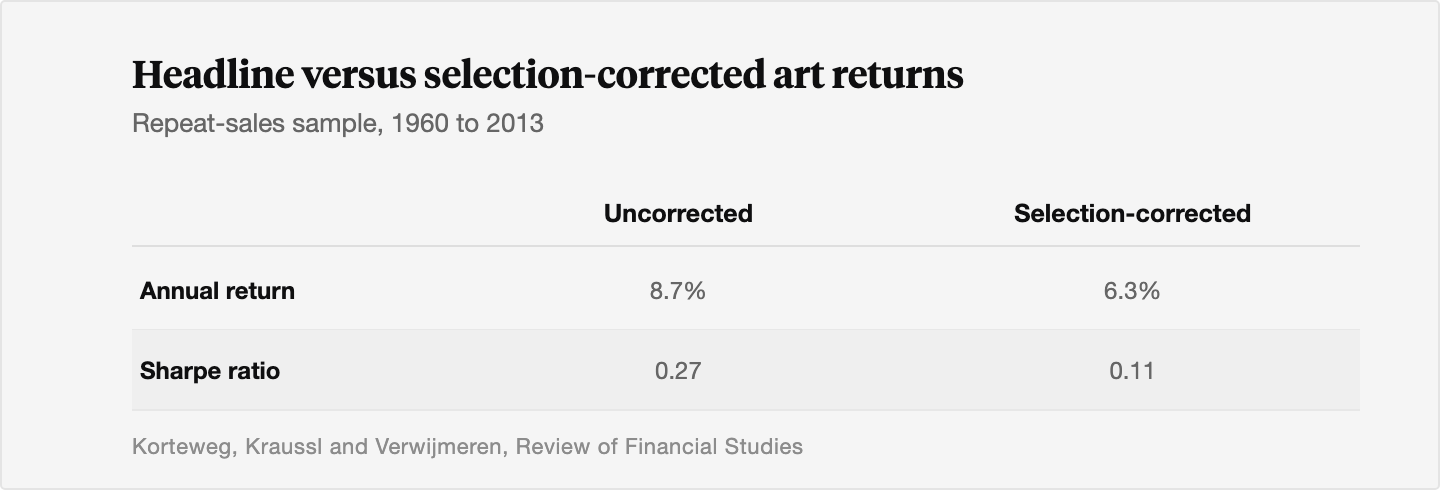
- Honest returns are mid-single-digit nominal, not double-digit. Korteweg, Kraussl and Verwijmeren show that correcting for the fact that winners come back to auction more often cuts the headline repeat-sales return from about 8.7% to about 6.3% a year, and the Sharpe ratio from 0.27 to 0.11 [1]. Renneboog and Spaenjers reach broadly consistent long-run estimates near 3% to 4% real [2].
- Size it as a long-term illiquid sleeve. A defensible starting allocation for most clients is well under 5% of investable assets, often 1% to 3%, treated as loss-tolerant capital with a 7 to 10 year horizon and no role in a liquidity reserve [6].
- Every implementation route carries a cost stack closer to private markets than to ETFs. Auction buyer's premiums run near 25% of the hammer price, art funds commonly charge management fees plus roughly 20% of profits, and direct ownership adds storage and insurance of roughly 1% to 2% of value a year [4][5].
- The asset produces no cash flow, and the cycle is real. Art pays no coupon or dividend, can take months to sell, and has spent the last several years in a correction. The global market was about $59.6 billion in 2025, up 4% after a multi-year decline [7].
- The institutional appetite is rising even as the cautions hold. In Deloitte's most recent survey, 89% of wealth managers, collectors, and art professionals agreed art and collectibles should be part of a wealth management offering, the highest reading in the report's history [8].
1. The case for an art allocation: correlation, scarcity, and a separate clock
Start with the size of the thing, because scale is what makes the inefficiency interesting. The global art market did about $59.6 billion in sales in 2025, and Deloitte estimates that ultra-high-net-worth wealth tied to art and collectibles was about $2.174 trillion in 2022, projected near $2.861 trillion by 2026 [7][8]. This is a large, established asset class. Sotheby's has run public auctions for more than two centuries, and roughly half the market trades in the open at auction, which is more price transparency than most private alternatives offer.
The investment argument rests on three properties.
Low correlation to equities. The reason an advisor looks at art at all is that it tends to move to its own rhythm. Peer-reviewed work and the major sell-side surveys put the correlation of broad art indices to global equities in the 0.2 to 0.4 range, with correlation to government bonds and gold close to zero [3]. That is genuine diversification: an asset largely indifferent to the forces driving the rest of a portfolio. We would caution advisors against the stronger "near-zero correlation to stocks" version of this claim, which is a marketing simplification that does not survive an adjustment for how art indices are built. We return to that limitation in section 5.
Real-asset scarcity. Art is one of the few asset classes where supply in the major markets shrinks over time. When a great work enters a museum collection, it generally leaves the private market for good. The supply of canvases by a deceased blue-chip artist is fixed. No new Basquiats will be painted. Over long horizons this scarcity, combined with demand tied to the growth of global wealth, gives art the character of a real, durable store of value. We would stop short of calling it a precise inflation hedge. The academic record shows art preserving purchasing power over decades rather than tracking CPI year to year, and gold remains the better-documented short-horizon hedge [3].
A demand base concentrated at the very top. High-end art prices are, in effect, a call option on the wealth of the top fraction of a percent. A serious collection runs into the tens of millions, so the marginal buyer is a billionaire. That ties art demand to wealth creation at the extreme top of the distribution, a base that has historically grown faster than headline inflation and that, in our view, is being expanded again by a new generation of technology and AI fortunes.
2. The honest return evidence: what survives a correction for bias
This is the section most marketing skips, so we will spend the most time here. The headline returns you see for art come from repeat-sales indices, which track the same work across two or more sales, the same method Robert Shiller used for home prices. The method is sound. The problem is which works come back to auction.
Pieces that have appreciated are far more likely to be resold than pieces that have not, because owners sell winners and quietly hold or privately dispose of losers. A naive index built only on observed resales therefore captures a sample tilted toward winners, and it overstates the return to the whole population.
Korteweg, Kraussl and Verwijmeren measured this directly. Using a global auction sample of repeat-sale paintings traded from 1960 to 2013, they applied a selection correction and found that the standard, uncorrected index return of about 8.7% a year fell to about 6.3% once the bias was removed. The Sharpe ratio fell further, from 0.27 to 0.11 [1]. In an earlier version of the study covering 1972 to 2010, the correction cut the return from about 10.0% to about 6.5% and the Sharpe ratio from 0.24 to 0.04 [1]. The punchline of their portfolio work is sobering: feed a mean-variance optimizer the corrected numbers and it assigns art a zero weight under standard assumptions [1].
Renneboog and Spaenjers, working with long-run auction data and hedonic methods, land in a broadly consistent place: real returns to broad fine art on the order of 3% to 4% a year over the long run, roughly half of long-run real equity returns, with a materially lower Sharpe ratio [2]. We compare the two asset classes directly over a multi-decade window in Art versus stocks over the last 30 years.
A note on how to read these figures for clients. The corrected 6.3% nominal works out to roughly 3% to 4% real after inflation, and that is before an investor pays a single fee. Realized, after-cost returns for a fee-paying client will sit below the corrected index, not above it, because the index ignores transaction costs, storage, insurance, and any platform or fund fees. The defensible expectation to set is a positive long-run real return that is below equities, with wide dispersion across works and the real possibility of zero or negative outcomes on any single piece.
We treat this honesty as the foundation of the whole framework. An advisor who underwrites art on the 6.3% number, and prices in costs on top, is building on solid ground. An advisor who uses a double-digit headline is building on sand. Our own work on how published returns get distorted goes deeper on the mechanics in How sample selection bias distorts published art returns.
3. The role in a portfolio and how to size it
If the return is mid-single-digit and the asset is illiquid, why hold any at all? Because the diversification and real-asset properties can still improve a portfolio at the margin, provided the allocation is small, patient, and funded from capital the client can afford to leave alone.
The role we would assign art is a long-term, illiquid satellite sleeve, closer to a private equity commitment than to a liquid alternative. It belongs in the part of the portfolio earmarked for return and diversification over years, never in a liquidity reserve and never as an income source.
On sizing, the academic efficient-frontier studies that allow art up to 10% or 15% are model outputs that assume frictionless trading and ignore liquidity preference, so they overstate what is prudent for a real client [6]. A defensible policy for most high-net-worth clients who are not professional art investors is to start well under 5% of investable assets, often in the 1% to 3% range, including any art the client already owns. Stretching toward 5% is reasonable only for sophisticated ultra-high-net-worth clients whose core portfolio and liquidity needs are already fully funded and who treat the sleeve explicitly as loss-tolerant capital [6]. Within an existing alternatives bucket, art is best seen as a small carve-out, not a peer of private equity or private credit, which should generally be funded first.
The horizon is non-negotiable. Because the market transacts in episodes and the cost of a round trip is high, the planning horizon should be at least 7 to 10 years. A 3 to 5 year horizon is closer to a bet on near-term market fashion, with a higher risk of a forced-sale discount. The payoff for patience is well documented across art cycles, a point we examine in Why patience is rewarded in art markets, and the diversification benefit is most useful in exactly the equity drawdowns we explore in Art's impact on portfolio drawdowns.
A practical guardrail: review the sleeve periodically so that appreciation or additional purchases do not let art creep above its target without a deliberate decision to re-underwrite the position.
4. Implementation routes and their tradeoffs
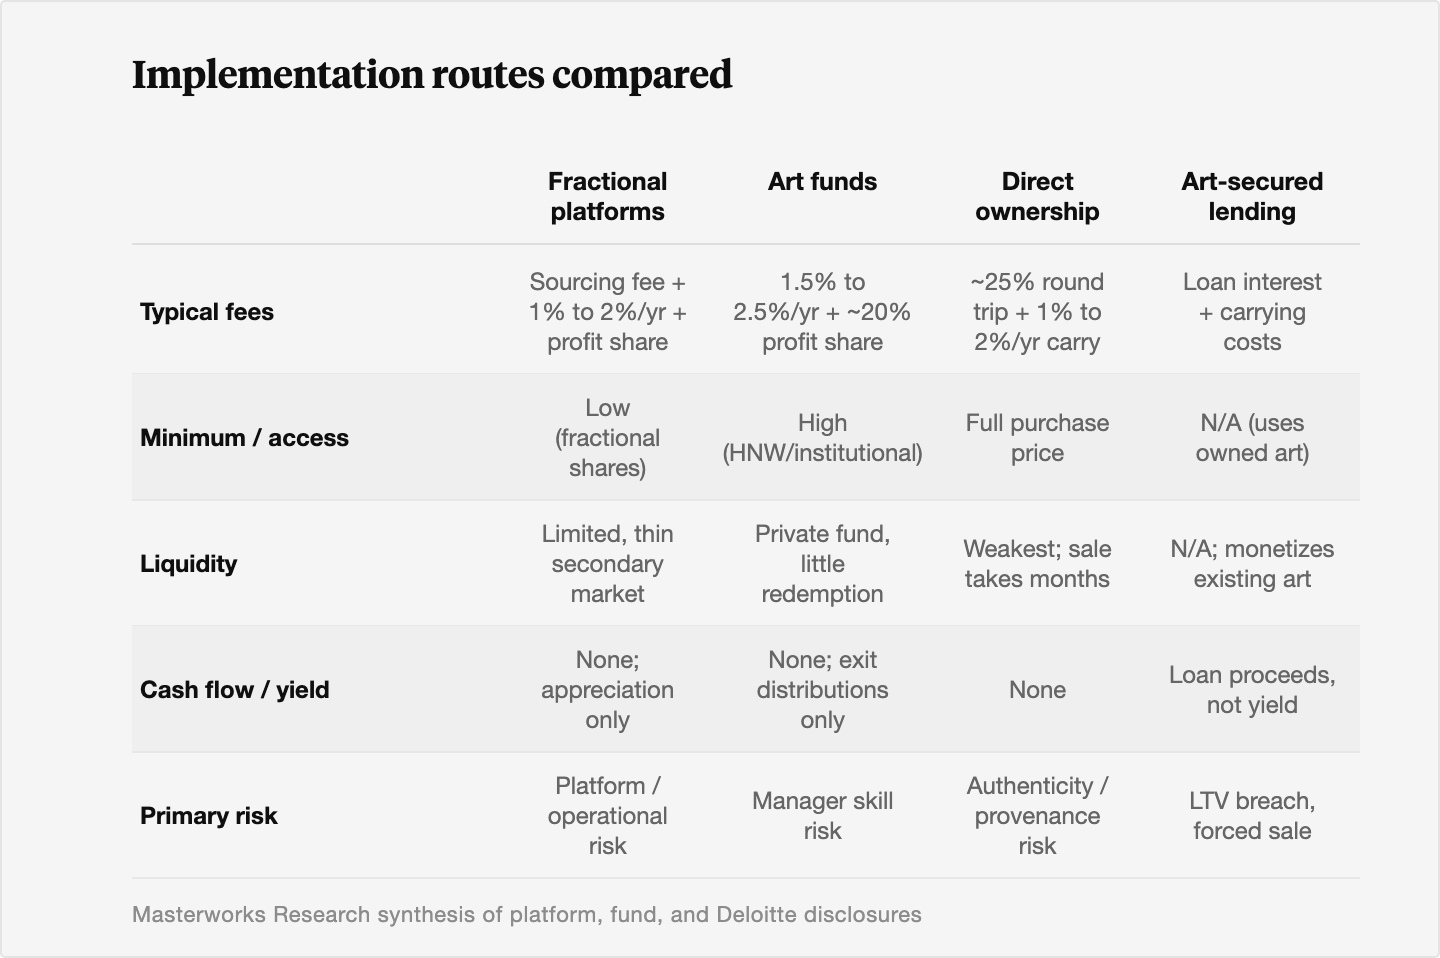
There is no broad art ETF or index fund. Every route to exposure is a private-markets-style decision, and each carries a distinct cost, liquidity, and risk profile. We lay out four, with the costs stated plainly because cost drag is the single biggest threat to a mid-single-digit return.
Fractional platforms. Securitized shares in individual works, typically held in single-asset entities or series and offered as SEC-qualified securities. The appeal is access and diversification of single-artist risk at a lower ticket than buying a painting outright. The cost stack usually includes an up-front sourcing fee, an annual management fee in the 1% to 2% range covering storage, insurance, and administration, and a profit share on sale, plus the auction costs embedded at acquisition and exit [4][5]. Liquidity is limited: holds of no set length, platform-controlled exit timing, and secondary trading that is thin or, at some platforms, closing. The added risk beyond the art itself is platform and operational risk, since custody, valuation, and any trading venue depend on one operating company.
Art funds. Pooled vehicles, usually closed-end limited partnerships with a 7 to 10 year life, marketed to high-net-worth and institutional investors. They diversify across works and hand the sourcing and timing to a manager. The fee model resembles private equity: management fees of roughly 1.5% to 2.5% a year plus a performance fee often near 20% of profits, with all auction, storage, and insurance costs borne at the fund level, so total annual cost can exceed 3% to 4% before the profit share [4][5]. Liquidity is private-fund illiquidity, with little to no redemption during the term. The dominant risk is manager skill, since outcomes hinge on sourcing, authentication, and exit timing.
Direct ownership. The client buys physical works through dealers, fairs, or auction. This is the route with the most control and the most non-financial utility, and it suits clients whose objective includes the enjoyment, social, or legacy value of the work. The costs are heavy and easy to underestimate: auction buyer's premiums near 25% of the hammer price, seller's commissions, dealer markups that can run 10% to 30%, and ongoing storage and insurance that together commonly run 1% to 2% of value a year [4][5]. There is no management fee but no manager either, so authenticity, provenance, condition, and selection risk sit entirely with the client. Liquidity is the weakest of all four routes; a sale can take months with an uncertain result.
Art-secured lending. This route does not create art exposure. It monetizes art the client already owns. Private banks and specialist lenders advance against a collection at a loan-to-value commonly around 50%, with lower ratios for more volatile segments [4]. It provides liquidity while the client retains the work, useful for funding other investments without a taxable sale. The risks come from the borrowing itself: a falling art market can trigger a loan-to-value breach and a forced sale at a poor time, and the interest plus carrying costs are a negative drag on the underlying asset.
In our view, for a client seeking financial rather than lifestyle exposure, a diversified fund or a well-disclosed fractional platform is usually more efficient than direct ownership, because it spreads single-artist risk and handles operations. The cost of that efficiency is a fee layer and platform or manager risk that the advisor must diligence the way they would any private-markets sponsor.
5. Risks and suitability: where the case can break
We have referenced the risks throughout. Here they are in one place, because an honest framework leaves them standing rather than waving them away.
Illiquidity. Art cannot be part of a liquidity reserve. Sales happen in episodes, spreads are wide, and a forced sale in a weak segment often clears at a deep discount. Size the allocation as capital that can be tied up, and potentially impaired, for years.
Valuation lag and stale pricing. Between sales, a work's value is an appraisal, not a market price. Because trades are infrequent, art indices smooth volatility and understate true risk, which mechanically lowers measured correlation [3]. Part of the apparent diversification benefit is a measurement artifact rather than real economic risk reduction. We use conservative correlation and volatility inputs for this reason.
Costs. As section 4 shows, the cost stack across every route is closer to private markets than to public funds. On a 6.3% gross expectation, a 25% round-trip auction cost and 1% to 2% annual carrying or management fees consume a large share of the return, and the profit share on funds and platforms takes more [1][4][5].
No cash flow. Art pays nothing while you hold it. The entire return is price appreciation that may or may not arrive. For any client whose goals require income or liability matching, art is a poor fit.
Manager and platform risk. Fund and platform routes add a layer of sponsor, custody, governance, and conflict risk on top of the art market itself. Due diligence should look like private-equity due diligence: realistic track record, fee transparency, valuation methodology, and legal structure.
The gap between marketed and realized returns. This is the through-line. Marketed CAGRs lean on uncorrected indices, ignore costs, and assume an access and timing most investors do not get. The prudent assumption is that a real client's after-fee outcome sits below the selection-corrected index, with more losers and a few large winners [1][6].
On suitability, the clean test is the standard one: liquidity need, time horizon, and risk tolerance. Art clears it only for clients with no near-term need for the capital, a horizon of 7 to 10 years or more, the risk tolerance for an idiosyncratic and illiquid position, and ideally some appetite for the non-financial value of the asset. For everyone else, the answer is no allocation, and that is a defensible answer.
6. How an advisor should think about fit
Pulling it together, the framework we would put in front of a client runs in five moves. Define the role first: art is a long-term, illiquid, non-yielding real asset whose job is diversification and, often, non-financial utility, never core return generation. Set expectations on the corrected numbers, a positive long-run real return below equities, with wide dispersion. Size it small, under 5% to start and frequently 1% to 3%, from loss-tolerant capital, with a horizon of 7 to 10 years or more. Choose the route by client objective: a fund or platform for financial exposure, direct ownership where enjoyment and legacy matter, lending only to monetize an existing collection. Then diligence the cost stack and the sponsor as rigorously as any private-markets commitment.
The institutional direction of travel supports a modest place for the asset. Deloitte's most recent survey found 89% of wealth managers, collectors, and art professionals agreeing that art and collectibles belong in a wealth management offering, the highest reading on record, with reported average allocations to art and collectibles of roughly 13.4% among family offices and 8.6% among private banks [8]. We look at where the most sophisticated allocators actually land in Art in multi-family-office portfolios. That advisors are being asked the question more often does not change the discipline of the answer.
We hold a clear view on the asset class and an equally clear view on its limits. Art can earn a small, patient seat in a diversified portfolio. It earns that seat on corrected returns and honest costs, not on headline numbers. An advisor who underwrites it that way can put it in front of a client with a straight face.
The Bottom Line
- Fine art can serve as a small, long-term, illiquid diversifier with low correlation to equities, but only when underwritten on selection-corrected returns rather than headline index figures.
- The defensible return expectation is roughly 6.3% nominal a year before costs, with a Sharpe ratio near 0.11, materially below equities on a risk-adjusted basis once the selection bias in repeat-sales indices is removed.
- A prudent starting allocation is well under 5% of investable assets, often 1% to 3%, funded from loss-tolerant capital and held for at least 7 to 10 years.
- Every implementation route, fractional platforms, art funds, direct ownership, and art-secured lending, carries a private-markets-style cost stack, so cost drag and after-fee outcomes must be modeled explicitly.
- The asset produces no cash flow, can take months to sell, and has spent recent years in a correction, so it is unsuitable for clients with near-term liquidity needs or income goals.
- Past performance is not predictive of future results, and the prudent assumption is that a client's realized, after-cost return will sit below any marketed index.
Sources
- Korteweg, Arthur; Kraussl, Roman; Verwijmeren, Patrick. "Does It Pay to Invest in Art? A Selection-Corrected Returns Perspective." Review of Financial Studies (SSRN working paper versions), 2013 to 2016. https://papers.ssrn.com/sol3/papers.cfm?abstract_id=2280099
- Korteweg, Kraussl and Verwijmeren working paper (1972 to 2010 sample). EconStor, 2013. https://www.econstor.eu/bitstream/10419/87687/1/771627165.pdf
- Citi GPS and academic correlation estimates summarized in art and finance commentary. State Street Global Advisors, "Gold as a Strategic Asset Class," accessed June 2026. https://www.ssga.com/us/en/intermediary/insights/gold-as-a-strategic-asset-class
- "Analysing art as a safe-haven asset in times of crisis." Journal of International Financial Markets, Institutions and Money, 2025. https://www.sciencedirect.com/science/article/pii/S1057521925002819
- SoFi. "Investing in Fractional Art: What to Know." SoFi Learn, accessed June 2026. https://www.sofi.com/learn/content/fractional-art/
- CAIA Association. "Art as a Purpose-Led Alternative Asset Class." CAIA, May 2023. https://caia.org/content/may-2023-art-purpose-led-alternative-asset-class
- Art Basel and UBS. "The Art Basel and UBS Art Market Report 2026" by Arts Economics (Dr. Clare McAndrew). Art Basel, March 2026. https://www.artbasel.com/stories/the-art-basel-and-ubs-global-art-market-report-2026?lang=en
- Deloitte Private and ArtTactic. "Art and Finance Report 2023" (8th edition). Deloitte, 2023. https://www.deloitte.com/lu/en/Industries/investment-management/blogs/snapshot-last-deloitte-private-arttactic-art-finance-report.html
- Morgan Stanley. "Art as an Investment Class." Morgan Stanley Wealth Management, accessed June 2026. https://advisor.morganstanley.com/team-581/articles/managing-significant-wealth/art-as-an-investment-class
- Quantpedia. "Portfolio Diversification Including Art as an Alternative Asset." Quantpedia, accessed June 2026. https://quantpedia.com/portfolio-diversification-including-art-as-an-alternative-asset/
- Citrin Cooperman. "Investing in Art: A Growing Asset Class." Citrin Cooperman In Focus Resource Center, accessed June 2026. https://www.citrincooperman.com/In-Focus-Resource-Center/Investing-in-Art-A-Growing-Asset-Class
- Stanford Graduate School of Business. "Is Art a Good Investment?" Stanford GSB Insights, accessed June 2026. https://www.gsb.stanford.edu/insights/research-art-good-investment
- Luxury Tribune. "Global Art Market Report 2026: Global Sales Grew by 4% in 2025." Luxury Tribune, March 2026. https://www.luxurytribune.com/en/global-art-market-report-2026-global-sales-grew-by-4-in-2025
- CAIA Association. "Nailing Alternative Investment Portfolio Construction, Part I." CAIA Blog, February 2023. https://caia.org/blog/2023/02/22/nailing-alternative-investment-portfolio-construction-part-i-0
Disclosures
Investing involves risk. Past results are not indicative of future outcomes.
Masterworks is providing this communication as an agent for its issuer entities, not Masterworks Advisers. This material is produced by Masterworks for informational purposes only and does not constitute investment advice, a recommendation, or an offer or solicitation to buy or sell any security. Masterworks is not a licensed broker-dealer by the SEC or FINRA.
Masterworks can only make and accept sales after an offering statement has been filed, and "qualified", by the SEC. Any offers may be revoked before notice of qualification. Indications of interest involve no obligation. For further disclosure visit the offering documents filed with the SEC and Important Disclosures at masterworks.com/cd.
Forward-looking statements and internal estimates are based on assumptions that may prove incorrect, and actual outcomes may differ materially. Figures denoted in brackets are subject to confirmation. Investing in art and alternative assets involves risk, including loss of principal.
Art sales price data is comparative only. Each painting is unique and historical data is not a direct proxy for any specific painting or investment. Data represents whole art, not an investment into our offerings which includes fees and expenses. Any comparative images are not currently live offerings and are provided for educational purposes only.
Masterworks, LLC is located at 1 World Trade Center, 57th Floor, New York, NY 10007.


