Masterworks Research · June 2026
What Markowitz got right about diversification, where the math quietly fails in the real world, and what both mean for adding a low-correlation asset like art.
Modern portfolio theory is the idea, formalized by Harry Markowitz in 1952, that an investor should judge an asset not on its own return but on what it does to the risk and return of the whole portfolio. The core insight is that risk is not additive. When you combine assets that do not move in lockstep, the volatility of the combination is lower than the average volatility of the parts, so diversification can raise expected return per unit of risk for free [1][2]. That single result reorganized how the investment world thinks about allocation, and it earned Markowitz a share of the 1990 Nobel Memorial Prize in Economic Sciences [3]. The reason it matters here is that the same framework, used honestly, is the cleanest argument for why a low-correlation asset like art can earn a place in a portfolio. Used carelessly, it is also the fastest way to overstate that case.
What You Need to Know
- The whole theory turns on correlation, not on picking winners. Markowitz showed that two assets with low or negative correlation reduce portfolio volatility when combined, which is why diversification is often called the only free lunch in finance [1][3]. The math rewards assets that march to their own clock.
- Mean-variance optimization is exquisitely sensitive to its inputs. Richard Michaud called the model an "estimation-error maximizer," because tiny errors in the expected-return estimates get amplified into large, concentrated, and often nonsensical portfolio weights [4][5]. This is the so-called Markowitz enigma.
- It assumes returns are normal and correlations are stable. They are neither. Real returns have fat tails, and correlations across assets rise sharply in crises. Page and Panariello (2018) found that left-tail correlations are far higher than normal-period correlations, so diversification tends to fail exactly when it is needed most [6][7].
- The model is single-period. Most investors are not. Standard mean-variance optimization fixes allocation at the start of one period and ignores multi-year horizons, mean reversion, taxes, and transaction costs [8].
- The theory says a low-correlation asset like art helps. The honest version says, less than the naive numbers suggest. Art has historically shown low correlation to equities, which is what the model rewards [9]. But art indices smooth volatility and carry selection bias, so a naive optimizer overstates the benefit. Past performance is not predictive [10][11].
1. What modern portfolio theory actually says
Start with the problem Markowitz set out to solve in his 1952 paper "Portfolio Selection" in the Journal of Finance. Before him, the sensible-sounding advice was to buy the assets with the highest expected returns. Markowitz showed why that is wrong. An asset that returns 10% on its own can make a portfolio safer or riskier depending entirely on how it moves relative to everything else you hold [1][2].
The mechanism is correlation. Portfolio risk, measured as variance, is not the average of the individual variances. It depends on the covariances between every pair of holdings. Combine two assets that tend to rise and fall together and you get little risk reduction. Combine two that move independently, or in opposition, and the swings partly cancel. The volatility of the blend comes in below the weighted average of the two. You lowered risk without lowering expected return, which is the closest thing investing offers to a free lunch [3].
That is the entire engine. Everything else in the theory is the apparatus for finding the best mix. We cover the curve itself, the set of portfolios that deliver the most return for each level of risk, in a separate piece on the efficient frontier. Here the point is narrower: the value of any one asset in this framework is set by its correlation with the rest, not by its standalone return.
2. The risk-free asset and the capital market line
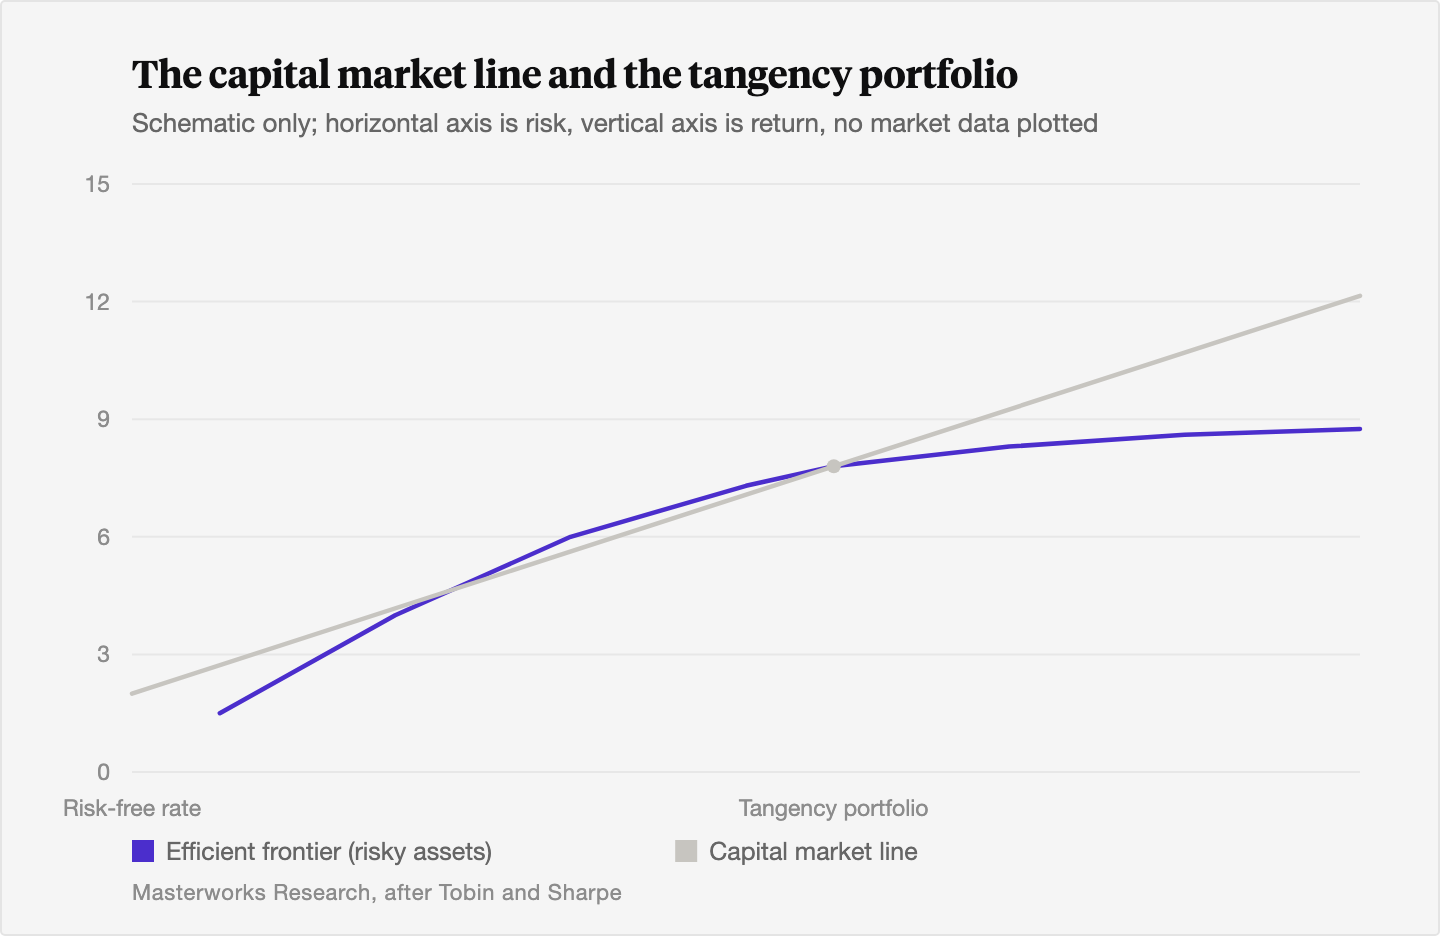
Markowitz gave us the frontier of risky assets. The next step, developed by James Tobin and later William Sharpe, added a risk-free asset, something like a short-term Treasury bill, and asked what happens when you can also lend or borrow at that rate.
The answer is clean. Draw a straight line from the risk-free rate up to the point where it just touches the curved frontier. That tangency point is a single portfolio of risky assets. The line itself is the capital market line, and every point on it is a mix of the risk-free asset and that one tangency portfolio [12]. Its slope is the Sharpe ratio of the tangency portfolio, the excess return earned per unit of risk, which is why the tangency portfolio is the one that maximizes the Sharpe ratio [12]. We unpack that measure in our explainer on the Sharpe ratio and risk-adjusted returns.
The practical consequence is striking. In theory, every investor holds the same risky portfolio and simply varies how much cash they keep alongside it. Conservative investors hold more of the risk-free asset, aggressive ones borrow to hold more of the tangency portfolio, but the risky mix is identical for everyone. This is Tobin's separation theorem, and it is the bridge from Markowitz's portfolio math to the Capital Asset Pricing Model. It is elegant. It is also where the theory starts to drift from how markets actually behave.
3. The Markowitz enigma: estimation error breaks the optimizer
The first and most damaging limit is hiding in plain sight. The optimizer needs three sets of inputs: expected returns, volatilities, and the correlations between every pair of assets. It treats whatever numbers you feed it as if they were known with certainty. They are not. They are estimates, usually built from historical data, and they carry large errors [4].
Here is what goes wrong. The optimizer is built to exploit any edge it can find, so it pours weight into whatever asset has the highest estimated return relative to its risk. If that estimate is off by even a little, the model does not hedge against the possibility. It doubles down. Richard Michaud named this in a 1989 Financial Analysts Journal paper, calling mean-variance optimization an "estimation-error maximizer," because it tends to maximize the effect of input errors rather than dampen them [5]. The result is portfolios with extreme, concentrated, unstable weights that often perform worse out of sample than a naive equal-weighted split.
The errors are not evenly distributed across the inputs. Chopra and Ziemba (1993) showed that errors in expected returns matter roughly an order of magnitude more than errors in variances, and that errors in variances matter more than errors in correlations [4]. Jagannathan and Ma (2003) put it bluntly: the estimation error in expected returns swamps everything else [4]. Since expected returns are the single hardest quantity in finance to estimate, the theory's most important input is also its least reliable one. Practitioners patch this with constraints, shrinkage, and Bayesian methods like Black-Litterman, but the underlying fragility is structural. This is the Markowitz enigma: the more precisely you optimize, the more you amplify your own ignorance.
4. Returns are not normal, and tails are where you get hurt
Mean-variance optimization measures risk with a single number, variance, which fully describes a return distribution only if that distribution is normal, the symmetric bell curve. Markets do not oblige. Real asset returns are skewed and have fat tails, meaning extreme moves, especially extreme losses, happen far more often than a normal distribution predicts [13].
This is not a footnote. Variance treats a 20% gain and a 20% loss as equally undesirable, and it assigns near-zero probability to the kind of crash that actually arrives every decade or so. The 2008 subprime crisis was a tail event the normal model said should almost never occur [13]. An optimizer fed normal assumptions will systematically understate the true risk of loss, because the danger lives in the part of the distribution the model barely acknowledges. For an investor, the gap between "the model's risk" and "the risk that can wipe out a year of gains" is the gap that matters.
5. Correlations rise in a crisis, exactly when you need them low
The fourth limit may be the cruelest, because it attacks diversification itself. Mean-variance optimization assumes correlations are stable. In reality, they move, and they move in the worst possible direction during a sell-off. When markets fall hard, assets that normally drift independently start falling together. Investors sell everything liquid to raise cash, and the correlations that justified the diversification benefit converge toward one [7].
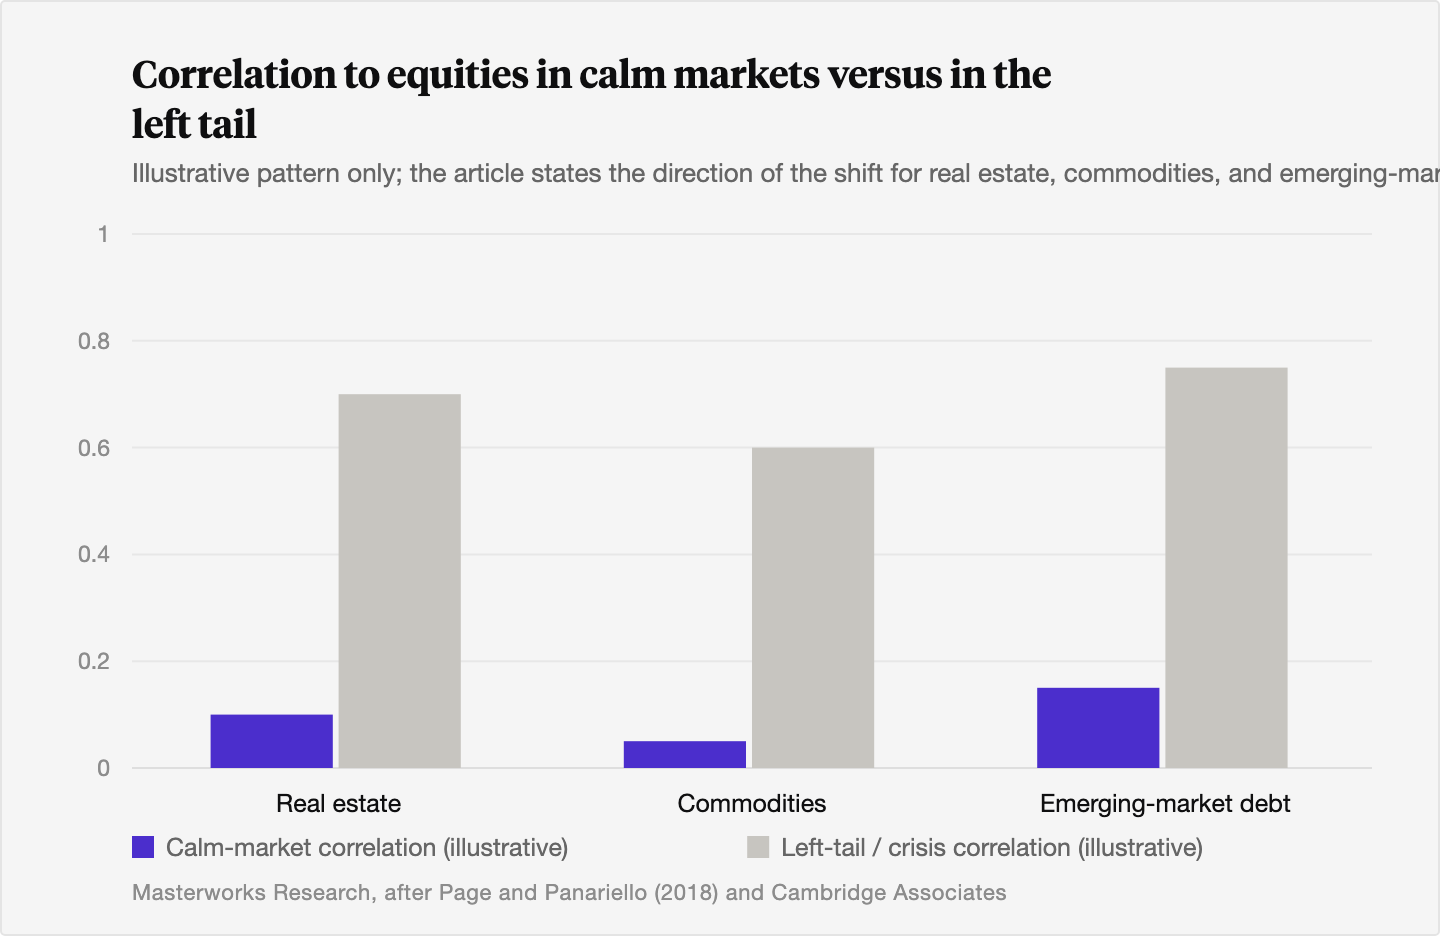
The evidence is direct. Sebastien Page and Robert Panariello, in a 2018 Financial Analysts Journal paper titled "When Diversification Fails," measured correlations separately in calm markets and in the left tail. Across styles, sizes, geographies, hedge funds, and private assets, left-tail correlations were far higher than normal-period correlations [6]. In 2008, asset classes that had shown low or negative correlation to equities, including real estate, commodities, and emerging-market debt, swung to high positive correlations as everything sold off at once [7]. Diversification tends to disappear at the moment it is supposed to protect you. That dynamic is what drives portfolio drawdowns, a subject we examine in detail in art's impact on portfolio drawdowns.
6. The single-period assumption and other simplifications
The classic model is single-period. It assumes you set your allocation once, at the start of one holding period, and do not touch it until the end [8]. Most real investors do not live in one period. They hold for years, rebalance, face taxes on every sale, pay transaction costs, and may want to respond to mean reversion or changing conditions along the way. None of that fits inside the one-period frame, which is why the standard model is often called myopic [8].
A handful of other assumptions sit underneath the theory and rarely hold cleanly. The model assumes investors care only about mean and variance, that markets are frictionless, that everyone can borrow and lend at the same risk-free rate, and that all investors share the same forecasts. Each is a useful simplification for building the math. Each is also a place where the polished output can diverge from a real portfolio. We are not arguing the theory is useless. We are arguing it is a lens, and a lens distorts at the edges. The discipline is knowing where the distortion lives before you act on the picture.
7. What modern portfolio theory says about adding art, and the honest caveats
Now bring it back to the asset we know best. The theory's verdict on a low-correlation holding is unambiguous. An asset that moves to its own rhythm lowers portfolio variance when you add it, even if its standalone return is unremarkable, because the optimizer rewards the diversification, not the headline number. Real diversification means owning something largely indifferent to the forces driving everything else. Art fits that description on the data we have: studies and the Deloitte Art and Finance work have repeatedly found low correlation between art and equities [9][10]. On the pure logic of Markowitz, that low correlation is the entire case for a small allocation.
Now the honest part, because the same limits we just walked through apply with extra force to art, and a naive optimizer will overstate the benefit. Two biases pull in the same direction.
First, appraisal and repeat-sale smoothing understate volatility. Art does not trade continuously, so its measured returns are stitched together from infrequent sales. Illiquid, infrequently priced assets show artificially smooth return series, and removing that smoothing can raise the measured risk substantially, by an estimated 60% to 100% in studies of illiquid assets [11]. A series that looks calm because it is rarely marked is not actually calm. Feed that low, smoothed volatility into an optimizer and it will recommend more of the asset than the true risk warrants.
Second, selection and survivorship bias inflate returns. Art indices are built from works that sold, often the works in highest demand, while unsold lots and quietly held works are missing from the data [10]. The repeat-sale indices that anchor most art research, including the long-running Mei and Moses series, measure only works that came back to auction at Sotheby's and Christie's, which tilts the sample toward winners [10]. The reported return is real for the works in the index. It is not the return of the average painting.
Put those together and the lesson is specific. Mean-variance optimization will say art deserves a place in a diversified portfolio, and on correlation grounds we believe that is right. But if you plug raw art-index numbers straight into the optimizer, the low smoothed volatility and the upward-biased return will tell you to hold far more than is prudent. The right move is to discount both inputs before you trust the output, and to treat art as a long-term, illiquid allocation rather than a line in a one-period model. Past performance is not predictive, for art or for anything else. For advisors weighing exactly this question, we lay out the practical version in art as an alternative allocation.
The Bottom Line
- Modern portfolio theory's enduring insight is that correlation, not standalone return, determines what an asset does to a portfolio, and that combining low-correlation assets lowers risk without lowering expected return.
- The theory's most dangerous flaw is estimation error. Mean-variance optimization amplifies small input errors into large, unstable portfolio weights, a problem Michaud named the estimation-error maximizer and that Chopra and Ziemba traced mainly to expected-return estimates.
- The model assumes normal returns and stable correlations, and both assumptions fail in crises, when fat-tailed losses arrive and correlations across assets converge toward one.
- The classic framework is single-period and frictionless, which ignores the multi-year horizons, taxes, and transaction costs that real investors face.
- On the theory's own logic, a low-correlation asset like art earns a place in a diversified portfolio, but appraisal smoothing and selection bias mean a naive optimizer overstates that benefit, so the inputs should be discounted and past performance treated as no guide to the future.
Sources
- Markowitz, Harry. "Portfolio Selection." The Journal of Finance, Vol. 7, No. 1, March 1952, pp. 77-91. https://www.jstor.org/stable/2975974
- Britannica Money. "Modern Portfolio Theory: Definition, Examples, and Limitations." Britannica, 2025. https://www.britannica.com/money/modern-portfolio-theory-explained
- Fidelity Australia. "Diversification is the only free lunch in finance." Fidelity, 2024. https://www.fidelity.com.au/insights/investment-articles/diversification-is-the-only-free-lunch-in-finance/
- Palomar, Daniel P. "Drawbacks of Mean-Variance Portfolio Optimization." Portfolio Optimization Book, 2024. https://portfoliooptimizationbook.com/book/7.5-MVP-drawbacks.html
- Michaud, Richard O. "The Markowitz Optimization Enigma: Is 'Optimized' Optimal?" Financial Analysts Journal, Vol. 45, No. 1, 1989, pp. 31-42. https://www.tandfonline.com/doi/abs/10.2469/faj.v45.n1.31
- Page, Sebastien, and Robert A. Panariello. "When Diversification Fails." Financial Analysts Journal, Vol. 74, No. 3, July 2018, pp. 19-32. https://ideas.repec.org/a/taf/ufajxx/v74y2018i3p19-32.html
- Cambridge Associates. "Diversification Challenges." Cambridge Associates Insights, 2024. https://www.cambridgeassociates.com/insight/diversification-challenges/
- The Intact One. "Modern Portfolio Theory: Assumptions, Applications, and Criticism." 2024. https://theintactone.com/2024/04/14/modern-portfolio-theory-assumptions-and-applications-criticism/
- Deloitte and ArtTactic. "Art and Finance Report 2023." Deloitte Luxembourg, 2023. https://www.deloitte.com/lu/en/services/consulting-financial/research/art-finance-report.html
- Mei, Jianping, and Michael Moses. "Art as an Investment and the Underperformance of Masterpieces." American Economic Review / SSRN working paper, 2002. https://pages.stern.nyu.edu/~wgreene/entertainmentandmedia/Mei-Moses.pdf
- Portfolio Optimizer. "Combating Volatility Laundering: Unsmoothing Artificially Smoothed Returns." Portfolio Optimizer Blog, 2024. https://portfoliooptimizer.io/blog/combating-volatility-laundering-unsmoothing-artificially-smoothed-returns/
- Wikipedia. "Capital Market Line." Accessed June 2026. https://en.wikipedia.org/wiki/Capital_market_line
- MDPI. "Markowitz Mean-Variance Portfolio Selection and Optimization under a Behavioral Spectacle: New Empirical Evidence." International Journal of Financial Studies, Vol. 10, No. 2, 2022. https://www.mdpi.com/2227-7072/10/2/28
Disclosures
Investing involves risk. Past results are not indicative of future outcomes.
Masterworks is providing this communication as an agent for its issuer entities, not Masterworks Advisers. This material is produced by Masterworks for informational purposes only and does not constitute investment advice, a recommendation, or an offer or solicitation to buy or sell any security. Masterworks is not a licensed broker-dealer by the SEC or FINRA.
Masterworks can only make and accept sales after an offering statement has been filed, and "qualified", by the SEC. Any offers may be revoked before notice of qualification. Indications of interest involve no obligation. For further disclosure visit the offering documents filed with the SEC and Important Disclosures at masterworks.com/cd.
Forward-looking statements and internal estimates are based on assumptions that may prove incorrect, and actual outcomes may differ materially. Figures denoted in brackets are subject to confirmation. Investing in art and alternative assets involves risk, including loss of principal.
Art sales price data is comparative only. Each painting is unique and historical data is not a direct proxy for any specific painting or investment. Data represents whole art, not an investment into our offerings which includes fees and expenses. Any comparative images are not currently live offerings and are provided for educational purposes only.
Masterworks, LLC is located at 1 World Trade Center, 57th Floor, New York, NY 10007.