Masterworks Research · June 2026
How a single statistical method puts a price on size, medium, signature, and provenance, why it powers art indices, and where it breaks down.
Hedonic regression is a statistical method that treats a painting as a bundle of measurable characteristics, things like size, medium, whether it is signed, its subject, its provenance, and the auction house that sells it, and then estimates how much each one contributes to the final price. The idea, formalized by the economist Sherwin Rosen in 1974, is that there is no separate market where you can buy "one extra square foot of canvas" or "a better provenance," so the prices of those traits sit hidden inside the price of the whole work. A regression run across thousands of sales pulls them back out. For an investor, this matters because it is one of the two main tools used to build art price indices, and because it puts a number on the intuition that two otherwise similar canvases by the same artist can sell for very different sums. This is a method we respect and use ourselves, with full awareness of where it breaks down. Below we walk through what it is, which characteristics it prices, how to read the output, how it compares to the repeat-sales approach, and the honest limits of what it can tell you.
What You Need to Know
- Hedonic regression prices a painting as a bundle of traits. It estimates the implicit price the market pays for each measurable characteristic, an idea formalized by Sherwin Rosen in 1974 and applied to art since the 1990s.
- Authentication and provenance are the largest measured drivers. Inclusion in a catalogue raisonne can lift a price 30% to 80%, and a prestigious prior owner has been estimated to add anywhere from 20% to more than 100%, ahead of medium, size, signature, subject, and the selling house.
- The output reads as percentage effects, not dollars. A model usually explains the log of price, so a coefficient of 0.25 on a signed dummy means roughly a 25% premium, with R-squared near 0.80 for a single well-documented artist and 0.50 to 0.70 across the broad market.
- Hedonic and repeat-sales make opposite tradeoffs. Hedonic uses every qualifying sale but risks omitting unmeasured quality, while repeat-sales controls for that quality by tracking the same work but discards most transactions and faces selection bias.
- The honest limits are real and unresolved. The method cannot fully capture quality, its coefficients drift over time, its output depends on model setup, and the masterpiece-performance debate remains genuinely open. Past performance is not predictive of future results.
1. What hedonic regression is and where it came from
The word "hedonic" comes from the Greek for pleasure, which is a clue to the core assumption: you buy a good for the satisfaction its features give you, so its price should reflect the sum of those features. The first real application was unglamorous. In 1939 an economist named Andrew Court, working for the Automobile Manufacturers Association, wanted to separate genuine quality improvement in cars from simple inflation, so he regressed car prices on horsepower, weight, and wheelbase [1]. Zvi Griliches carried the method into mainstream econometrics in 1961, again with automobiles [2].
The theory that made it rigorous arrived with Sherwin Rosen's 1974 paper "Hedonic Prices and Implicit Markets: Product Differentiation in Pure Competition," published in the Journal of Political Economy [3]. Rosen showed that in a competitive market the observed price function maps a vector of characteristics to a price, and the slope of that function with respect to any one characteristic is its "implicit price," the amount the market is willing to pay at the margin for a little more of it. That single idea, prices for traits that have no market of their own, is the whole engine.
The mechanics are a regression. You take the natural log of the sale price as the thing you are explaining, and you put the characteristics in as the explanatory variables:
log(price) = a + b1(size) + b2(signed) + b3(oil) + ... + year effects + error
The "year effects" are the part investors care about most. Once the model has stripped out the influence of every measured trait, what is left in the year terms is pure price movement over time, a quality-adjusted index. That is the bridge from a pile of messy auction results to a clean return series.
2. Which artwork characteristics drive value
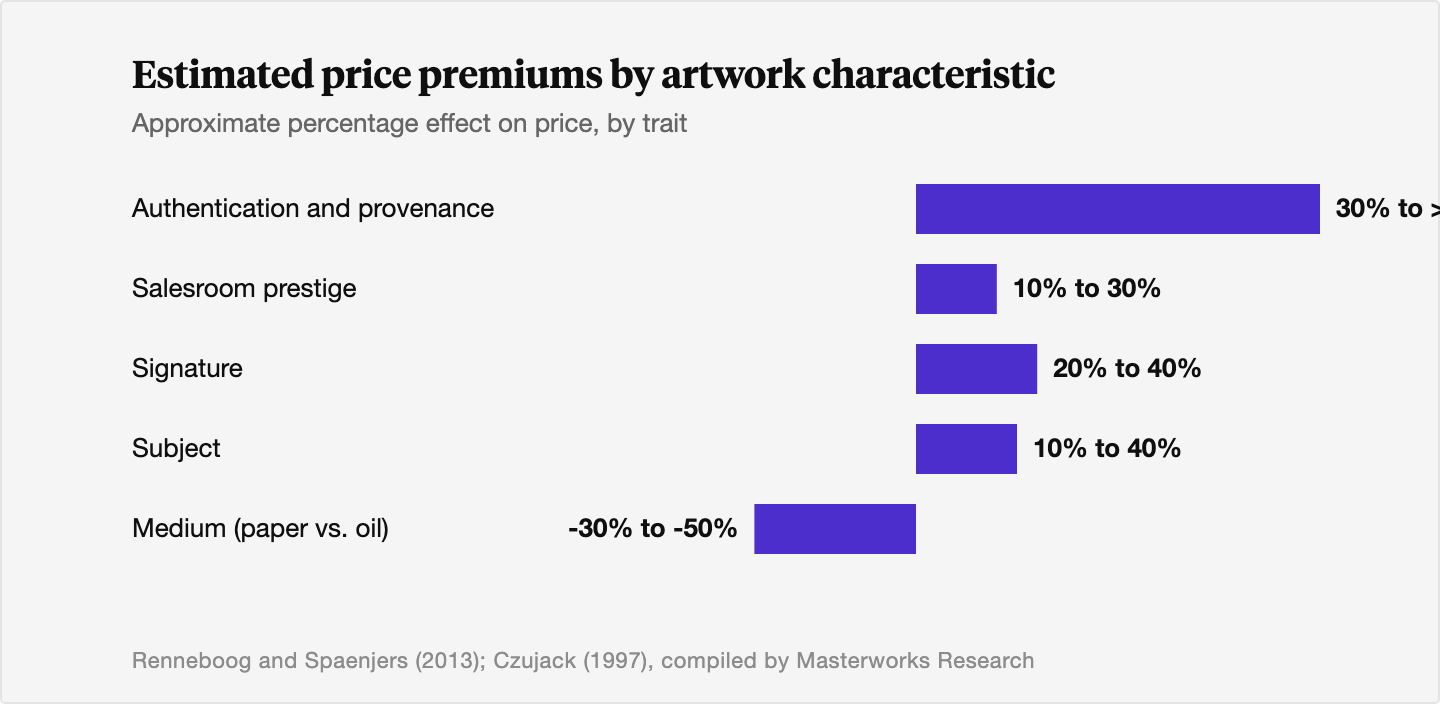
This is where the method earns its keep. Across the major academic studies, a fairly stable set of traits explains most of the variation in what a painting sells for. The numbers below are approximate percentage effects on price drawn from the art-economics literature, chiefly Renneboog and Spaenjers (2013) and Czujack's 1997 study of Picasso [4][5].
Size. Bigger sells for more, but at a declining rate. The relationship is concave, so doubling the surface area does not double the price. In log-log terms the elasticity tends to land between 0.3 and 0.7, meaning a 10% larger canvas commands roughly 3% to 7% more, all else equal [4][5].
Medium. Oil on canvas is the benchmark. Works on paper, watercolors, and drawings typically sell at a 30% to 50% discount to a comparable oil, and prints often trade 50% or more below [4][5].
Signature and date. A signed work carries roughly a 20% to 40% premium over an unsigned one by the same hand, and a dated work adds a smaller bump, often 5% to 20% [5].
Subject. Subject matter matters and it is artist-specific, but a recurring pattern is that portraits and nudes command a premium, often 10% to 40% over landscapes and still lifes [4][5].
Authentication and provenance. These are among the largest effects in the whole model, and they are the ones a casual observer underrates. Inclusion in an artist's catalogue raisonné, the scholarly master list of accepted works, can lift a price by 30% to 80%. A strong attribution ("by the artist" rather than "attributed to" or "school of") can multiply value several times over. A prestigious provenance, a famous prior owner or collection, has been estimated to add anywhere from 20% to more than 100% [4][5]. For more on why an artwork's ownership history carries so much weight, see our piece on why an artwork's history drives its value.
The salesroom itself. Where and when a work sells is priced too. Christie's and Sotheby's tend to achieve a 10% to 30% premium over regional houses for comparable works, and a New York or London evening sale prices above a secondary location [4][6]. Even position within a sale shows up: lots later in a long session tend to fetch a few percent less, an "afternoon effect" the data picks up cleanly.
The lesson for an investor is the one we keep coming back to in our own work: the artist market is paramount, and within it the difference between an A example and a C example is not a rounding error. Hedonic regression is the tool that quantifies exactly that gap. Past characteristic premiums are estimates from historical data and are not a guarantee of future pricing.
3. A worked example: two canvases, one artist
Make it concrete. Imagine two paintings by the same blue-chip postwar artist, coming to auction in the same season. Call them Canvas A and Canvas B.
Canvas A is a large oil, signed and dated, a portrait, included in the artist's catalogue raisonné, formerly in a well-known collection, offered in a New York evening sale. Canvas B is a medium-sized work on paper, unsigned, a landscape, not yet in the catalogue raisonné, with thin provenance, offered in a regional day sale.
A hedonic model does not throw up its hands at the difference. It prices it, line by line. The oil-versus-paper gap might be worth 40%. The size difference adds more. The signature is another 20% to 30%. The catalogue raisonné inclusion and the strong provenance together could be the largest single driver, plausibly doubling the base price or more. Stack the estimated effects and it is entirely ordinary for Canvas A to sell for several times what Canvas B brings, even though both are "a painting by the same famous artist." The market is being rational. It is paying implicit prices for a bundle of traits, exactly as Rosen described. The regression lets you read the receipt.
4. How to read the coefficients
The output of a hedonic regression is a table of coefficients, and reading it is simpler than it looks once you know two conventions.
Because the model usually explains the log of price, the coefficients translate roughly into percentage effects, not dollar effects. A coefficient of 0.25 on a "signed" dummy variable means a signed work sells for about 25% more, holding everything else constant. A coefficient of negative 0.40 on a "work on paper" variable means roughly a 40% discount to oil. The phrase "holding everything else constant" is the whole point: the method isolates the marginal contribution of one trait while the others are pinned in place.
Two diagnostics tell you how seriously to take the model. The first is statistical significance, whether a coefficient is reliably different from zero rather than noise. The second is the R-squared, the share of price variation the model explains. For a single, well-documented artist like Picasso, hedonic models reach an R-squared around 0.80 to 0.85, because the works are homogeneous and the records are good [5]. Across a broad, mixed market the figure falls, often to the 0.50 to 0.70 range [4]. That residual, the 15% to 50% the model cannot explain, is not a footnote. It is the part of value that lives in things the model never measured, and it is the source of nearly every limitation we discuss below.
5. Hedonic versus repeat-sales: the two ways to build an art index
Anyone serious about art as an asset class eventually runs into the same fork in the road, because there are two competing methods for turning auction results into a return series, and they make opposite tradeoffs.
Hedonic regression, the subject of this piece, uses every qualifying sale. Its weakness is that it can only control for the characteristics you actually observe and code, so anything you miss leaks into the results.
The repeat-sales method takes the other road. Pioneered for art by Jianping Mei and Michael Moses, and built on the same logic Robert Shiller used for the Case-Shiller home price index, it tracks the same object across two or more sales and measures only the change in price between them [7]. When the identical Warhol sells in 2018 and again in 2025, the difference is pure appreciation, because every fixed trait of that specific painting, observed or not, cancels out. That is the great strength: it controls automatically for unobserved quality.
The cost is brutal on data. Most paintings sell once in a generation, if at all, so a repeat-sales index throws away the vast majority of transactions and works from small, possibly unrepresentative samples. Mei and Moses built their landmark study from roughly 4,900 repeat-sale pairs spanning 1875 to 2000 [7]. It also suffers selection bias, because the works that happen to resell are not a random slice of the market.
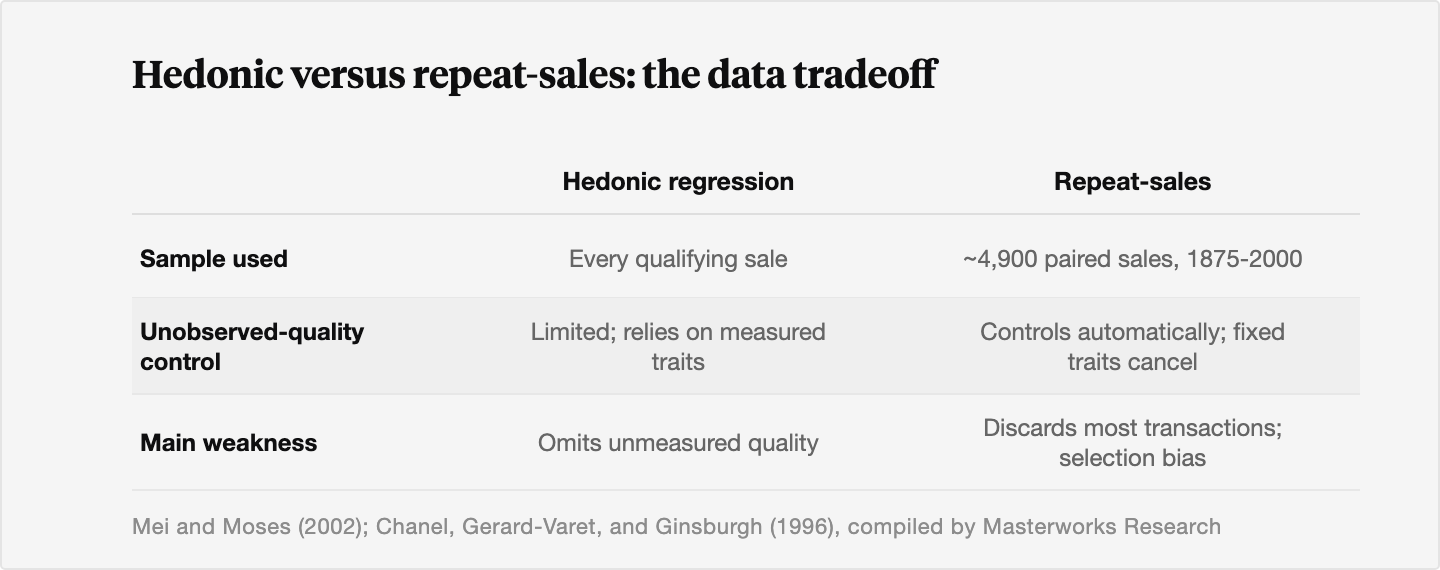
So the honest summary is that neither method wins outright, and the literature, including the foundational comparison by Chanel, Gerard-Varet, and Ginsburgh in 1996, treats them as complements [8]. Hedonic models are preferred when you have rich data on characteristics and want to use every sale or value a specific work. Repeat-sales is preferred when unobserved quality dominates and you care about the realized return on works that actually trade. A conservative analyst runs both on the same data and reads the gap between them as a signal. This is the same instinct behind our own index work, where we build the series the way Shiller built Case-Shiller, by following the same work across multiple sales rather than averaging a basket of different ones. A separate Academy article covers the full catalog of art indices in more depth.
6. What the models miss
A method is only as trustworthy as its stated limits, so here is where hedonic regression falls short. We use it and we do not oversell it.
It cannot fully measure quality. Beauty, condition subtleties, freshness to market, the indefinable rightness of a great picture, none of these are columns in a spreadsheet. In the language of econometrics this is omitted-variable bias, and it is the central problem. If the unmeasured quality is correlated with a trait the model does measure, say, the best examples also tend to be the larger ones, the model will wrongly credit size with value that really belongs to quality.
The masterpiece question is genuinely unsettled. You would think the most expensive trophy works would be the best investments. Mei and Moses, in the paper whose subtitle is "The Underperformance of Masterpieces," found the opposite in their repeat-sales data: the priciest works tended to lag the broader market on a risk-adjusted basis, plausibly because buyers accept a lower financial return in exchange for the prestige of ownership [7]. Later work using quantile regression, which examines different points of the price distribution rather than just the average, has found more complex and sometimes opposite patterns at the very top, with high-end works outperforming in booms [9]. The disagreement itself is the finding. Whether masterpieces over- or underperform depends on the method, the period, and how you define a masterpiece. Anyone who tells you the answer is settled is selling something.
Coefficients drift over time. The premium the market pays for a signature, a subject, or a particular period of an artist's career is not fixed. Taste moves. A model estimated over six decades quietly assumes the market valued an extra square centimeter the same way in 1965 and 2025, which is not true [4]. This time-instability of parameters is a known weakness flagged repeatedly in the art-pricing literature.
The model depends on its own setup. Change the functional form or the set of included variables and the estimated premiums, and the resulting index, can shift meaningfully. A hedonic index is best understood as a model-dependent estimate of price movement for a selected subset of works, not as ground truth handed down from the market.
Only sold works are observed. The data is the works that came to auction and actually sold. Pieces that failed to sell, that traded privately, or that sat in a family for generations never enter the regression. That selection is not random, and it can tilt the picture in ways no coefficient will reveal. And because every index is built from sales that already happened, it inevitably reports the market as it was, a structural delay we cover in our article on why art valuations are always looking backward.
7. What it means for valuing art as an investment
Strip away the math and the practical takeaway is steady. Hedonic regression is the formal version of what a good appraiser does by instinct: it breaks a price into the traits that produced it and tells you what each one is worth. It is, in effect, an automated version of the comparable-sales analysis appraisers use to build price estimates, scaled from a handful of comps to thousands of them. For an investor evaluating whether art belongs in a portfolio, that has real value. It explains why two paintings by the same artist are not interchangeable. It is one of the two credible engines, alongside repeat-sales, for building the kind of quality-adjusted index you need before you can talk seriously about returns, correlation, or risk-adjusted performance.
It also enforces humility, which is the part we value most. The residual the model cannot explain, that 15% to 50% of price variation, is a standing reminder that art carries a quality dimension no statistic captures cleanly. We think the right posture is to use the method for what it does well, pricing observable characteristics and adjusting for them over time, while staying honest about the omitted-variable problem at its core. The global art market reached an estimated $59.6 billion in 2025, with public auction sales up 9% to $20.7 billion, which is the raw material these models run on [10]. A method that turns that volume into a defensible return series is worth understanding, limits and all. Past performance of any index, hedonic or repeat-sales, is not predictive of future results.
The Bottom Line
- Hedonic regression treats a painting as a bundle of characteristics and estimates the implicit price the market pays for each one, an idea formalized by Sherwin Rosen in 1974 and applied to art since the 1990s.
- The biggest measured drivers of value are authentication and provenance, which can add 30% to well over 100%, followed by medium, size, signature, subject, and the prestige of the selling house, each carrying its own estimated premium.
- Coefficients are read as percentage effects on price; the R-squared shows how much the model explains, around 0.80 for a single well-documented artist and 0.50 to 0.70 for the broad market.
- Hedonic and repeat-sales are the two main index methods, and they make opposite tradeoffs: hedonic uses every sale but risks omitting unmeasured quality, while repeat-sales controls for quality but discards most transactions and faces selection bias.
- The method's honest limits are real: it cannot fully capture quality, its coefficients drift over time, its output depends on model setup, and the masterpiece-performance debate remains genuinely unresolved.
- Past characteristic premiums and index returns are estimates from historical data and are not predictive of future prices.
Sources
- Triplett, Jack E. "Andrew Court and the Invention of Hedonic Price Analysis." Journal of Econometrics, 1997 (discussing Andrew Court's 1939 automobile work). https://www.sciencedirect.com/science/article/abs/pii/S0094119097920714
- Griliches, Zvi. "Hedonic Price Indexes for Automobiles: An Econometric Analysis of Quality Change." The Price Statistics of the Federal Government, NBER, 1961. https://www.nber.org/books-and-chapters/price-statistics-federal-government
- Rosen, Sherwin. "Hedonic Prices and Implicit Markets: Product Differentiation in Pure Competition." Journal of Political Economy, Vol. 82, No. 1, 1974, pp. 34-55. https://www.journals.uchicago.edu/doi/10.1086/260169
- Renneboog, Luc, and Christophe Spaenjers. "Buying Beauty: On Prices and Returns in the Art Market." Management Science, Vol. 59, No. 1, 2013, pp. 36-53. https://pubsonline.informs.org/doi/10.1287/mnsc.1120.1580
- Czujack, Corinna. "Picasso Paintings at Auction, 1963-1994." Journal of Cultural Economics, Vol. 21, No. 3, 1997, pp. 229-247. https://link.springer.com/article/10.1023/A:1007365800833
- Arts Economics / Art Basel and UBS. "The Art Basel and UBS Global Art Market Report 2026" (2025 market data). 2026. https://theartmarket.artbasel.com
- Mei, Jianping, and Michael Moses. "Art as an Investment and the Underperformance of Masterpieces." American Economic Review, Vol. 92, No. 5, 2002, pp. 1656-1668. https://www.aeaweb.org/articles?id=10.1257/000282802762024719
- Chanel, Olivier, Louis-Andre Gerard-Varet, and Victor Ginsburgh. "The Relevance of Hedonic Price Indices: The Case of Paintings." Journal of Cultural Economics, Vol. 20, No. 1, 1996, pp. 1-24. https://www.jstor.org/stable/41810572
- "Generalizing the 'Masterpiece Effect' in Fine Art Pricing: Quantile Regression and Individual Artist Fixed Effects." Economic Modelling, Vol. 124, 2023. https://www.sciencedirect.com/science/article/abs/pii/S026499932300113X
- Art Basel and UBS. "Global Sales Rise 4% to $59.6 Billion in 2025, Amid Ongoing Market Recalibration." Art Basel, March 2026. https://www.artbasel.com/stories/the-art-basel-and-ubs-global-art-market-report-2026
- International Monetary Fund. "Hedonic Regression Methods" (methodology chapter, Handbook on Residential Property Price Indices). IMF eLibrary, 2013. https://www.elibrary.imf.org/display/book/9789279259845/ch005.xml
- Buelens, Nathalie, and Victor Ginsburgh. "Revisiting Baumol's 'Art as Floating Crap Game.'" European Economic Review, Vol. 37, No. 7, 1993, pp. 1351-1371. https://doi.org/10.1016/0014-2921(93)90015-L
Disclosures
Investing involves risk. Past results are not indicative of future outcomes.
Masterworks is providing this communication as an agent for its issuer entities, not Masterworks Advisers. This material is produced by Masterworks for informational purposes only and does not constitute investment advice, a recommendation, or an offer or solicitation to buy or sell any security. Masterworks is not a licensed broker-dealer by the SEC or FINRA.
Masterworks can only make and accept sales after an offering statement has been filed, and "qualified", by the SEC. Any offers may be revoked before notice of qualification. Indications of interest involve no obligation. For further disclosure visit the offering documents filed with the SEC and Important Disclosures at masterworks.com/cd.
Forward-looking statements and internal estimates are based on assumptions that may prove incorrect, and actual outcomes may differ materially. Figures denoted in brackets are subject to confirmation. Investing in art and alternative assets involves risk, including loss of principal.
Art sales price data is comparative only. Each painting is unique and historical data is not a direct proxy for any specific painting or investment. Data represents whole art, not an investment into our offerings which includes fees and expenses. Any comparative images are not currently live offerings and are provided for educational purposes only.
Masterworks, LLC is located at 1 World Trade Center, 57th Floor, New York, NY 10007.