Masterworks Research · June 2026
Why raw auction records are not yet data, the engineering it takes to make them usable, and what a clean dataset lets you measure that the rest of the market cannot.
A usable art transaction database is a corpus of auction and exhibition records that has been aggregated from thousands of separate houses, normalized to a single currency and a single set of categories, resolved so that every record points to the right artist and the right artwork, and then reviewed by people for the errors that automation misses. The reason this is hard is that auction records are published one house at a time, in dozens of formats, in scores of currencies, with no shared identifier for either the artist or the work. Getting from that raw material to something an investor can actually measure returns on is a data-engineering problem before it is an art problem. For investors, the quality of that underlying database determines whether every downstream number, the index, the comp, the price estimate, is signal or noise.
What You Need to Know
- Auction records are a starting point, not a dataset. Half of the art market trades at public auction, and public auction sales reached roughly $20.7bn in 2025 [1]. That data is public, but it is published house by house, in different formats, with no common key linking one record to the next.
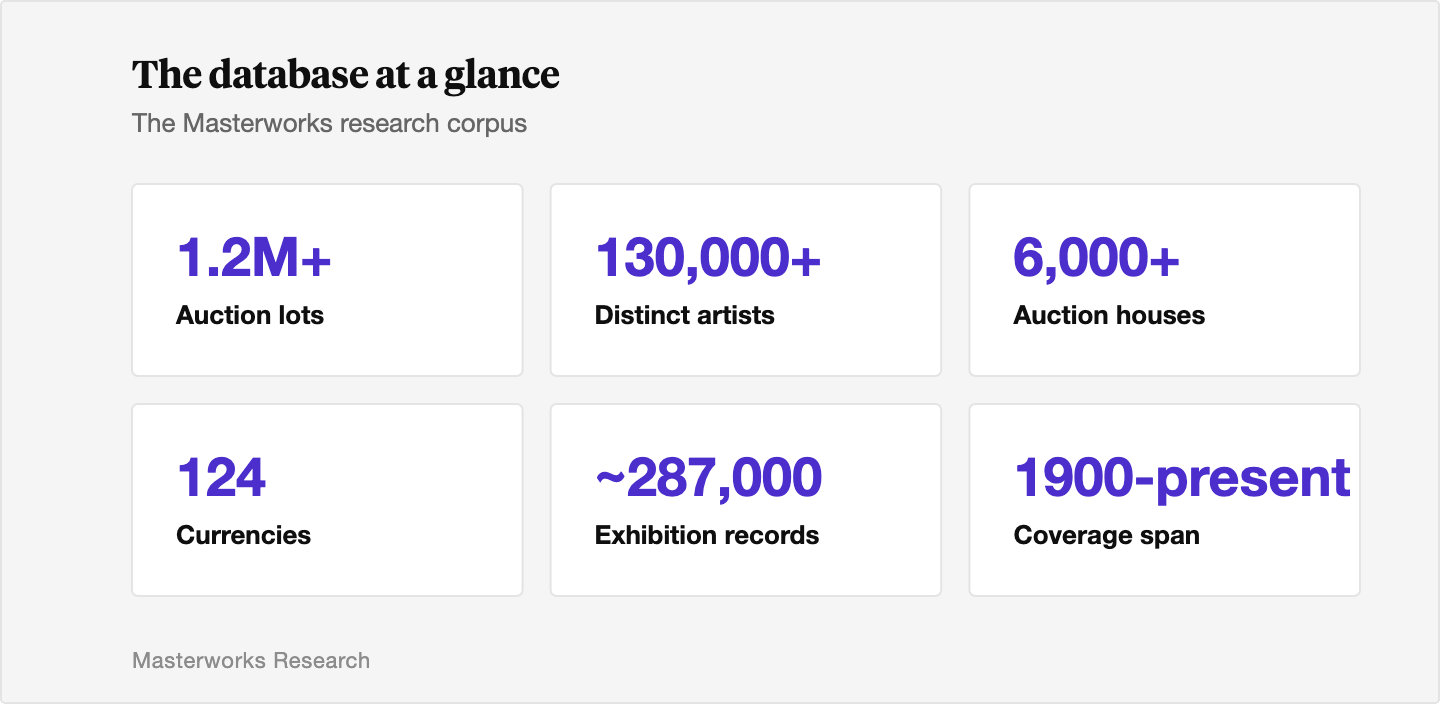
- Coverage is the first wall. The global auction market is highly fragmented, with several thousand houses worldwide and more than 500,000 artists who have appeared at auction [2]. Masterworks' own research database now spans more than 1.2 million auction lots from over 6,000 auction houses, covering more than 130,000 distinct artists.
- Currency and naming are the next two walls. Our records arrive in 124 different currencies, each converted to USD at the exchange rate on the sale date, and a single artist can appear under many spellings and name orders that have to be resolved to one canonical identity.
- Automation gets you most of the way, people get you the rest. A large share of artist names standardize automatically; the remainder, plus duplicate works, ambiguous mediums, and messy historical records, run through a human review layer. Masterworks describes its total research corpus as [50M+ records].
- The payoff is measurement. A clean database is what makes a repeat-sales index, a defensible comparable, and a machine-learning price model possible. The same data problems that limit public indices, survivorship and the exclusion of unsold lots, do not fix themselves; a usable database makes them visible and correctable.
1. Why art data is hard before it is useful
Start with a fact that surprises people. When we set out to measure how much art appreciates, the data we needed did not exist in usable form. Scott has described the origin plainly: there was no API for the art market, so the firm hired dozens of interns and bought thousands of paper auction catalogs, then had them record each event of a painting that was bought and later sold. That manual digitization, repeated millions of times, is the unglamorous foundation under every chart we publish.
The reason it had to be done by hand is structural. Half of the art market trades at public auction, which means the prices exist and are public [3]. Sotheby's has been holding auctions since 1744 and Christie's since 1766 [2], so the historical record runs back centuries. But that record was never built to be queried. Each house publishes its own catalogs, in its own format, with its own categories, in its own currency. There is no shared identifier for an artist and no shared identifier for a work. A record that says "Picasso, oil, 1932, sold for FF 4,200,000" in a 1990 Paris catalog and a record that says "Pablo Ruiz Picasso, huile sur toile, $812,000" in a 2010 New York catalog may or may not be the same painting, and nothing in the raw data tells you.
Academic researchers hit the same wall. The studies that attempt to model art prices, including a well-known paper that applied neural networks to one million painting auctions [4], spend much of their effort on cleaning and encoding before any modeling begins, because auction data is sparse, heterogeneous, and inconsistently recorded across houses and decades [5]. The engineering is the precondition. Until the records are aggregated, normalized, and resolved, they are not a dataset. They are a pile.
2. The aggregation and coverage problem
The first engineering problem is breadth. The global auction market is not a handful of marquee names; it is several thousand houses, and the long tail outside the largest firms is where coverage gaps open up [2]. Commercial databases reflect this unevenly. The most widely cited public source covers more than 1,800 auction houses and around 340,000 artists [6], and one academic description of its earlier coverage put it at results from over 500 houses since 1985 across more than 3.5 million artworks [4]. Other providers are far narrower by design: one long-running index firm, founded in 1978, builds its series from roughly 60,000 lots per year, a deliberately limited slice of the market [7].
Masterworks' research database sits at more than 1.2 million auction lots drawn from over 6,000 auction houses. The point of aggregating that many sources is not size for its own sake. It is representativeness. If you only ingest the top three houses, your data overweights the high end and the most liquid works, which biases every average you compute. Pulling from thousands of houses widens the base, but it multiplies the formatting problem: every new source is a new schema to map into a common model.
There is a coverage gap that no amount of aggregation closes, and it is worth being honest about. Auction records capture works that sold. They do not capture private dealer sales, which are more than half of the market by value, and within auctions they typically exclude lots that failed to sell. We cover the share of the market that transacts in public, which is the share with reliable prices. We size and discuss this limit directly in how reliable are repeat-sales indices for art and in what indices track art market performance and their limitations.
3. Currency and price normalization
Once the records are aggregated, the prices are not yet comparable. Our data arrives in 124 different currencies, from US dollars and pounds and euros to Hong Kong dollars, yuan, and Swiss francs, recorded across decades that include pre-euro francs and marks. A hammer price of "4,200,000" means nothing until you know the currency, the date, and the exchange rate that applied on that date.
Normalization is a reference-data exercise. Each sale is mapped to a canonical currency code, then converted to USD using the exchange rate on the sale date rather than today's rate, because a 1995 sale in francs has to be measured against the franc's 1995 value, not its value at conversion time. That requires a dense daily history of exchange rates, with logic for weekends and holidays, stored alongside the original amount so the conversion can be audited and reproduced. A note on how we keep this honest: we retain the original currency and amount, the rate applied, and the converted figure, so any number can be traced back to its source.
Price normalization is the same discipline applied to the components of a sale. Auction records mix hammer price, price including buyer's premium, and figures that may or may not include taxes and duties. Treating those as interchangeable would corrupt any return calculation. The records have to be normalized to explicit, consistent fields before they can be averaged or indexed. This is the kind of detail that does not show up in a headline but determines whether the headline is true.
4. Artist-name entity resolution
The hardest standardization problem is figuring out who made the work. The same artist appears in the raw data under many forms: "Pablo Picasso," "Picasso, Pablo Ruiz," "P. Ruiz Picasso," and transliterations across scripts for non-Western names. There are typos, dropped diacritics, inverted name orders, and the genuinely difficult case of two different artists who share a name. This is a classic record-linkage problem, the same one that census, healthcare, and customer-data teams have worked on for decades [5].
The way you solve it is in tiers. Deterministic rules catch the clean cases: if a normalized last name, first name, and birth year all agree, the records are the same artist. Probabilistic and machine-learning matching handle the noisy middle, scoring name similarity with edit-distance and token-based measures, weighing birth and death years and nationality, and producing a match probability [5]. Above a high threshold the system links automatically. Below a low threshold it separates. The gray zone in between goes to a person.
In our database, a large share of artist names standardize automatically to a single canonical artist; the rest require matching. That residual is not a rounding error. With more than 130,000 distinct artists in the corpus, even a small fraction of ambiguous names is a meaningful queue, and getting it wrong contaminates everything downstream. An artist-level appreciation rate is only as good as the certainty that every record in it belongs to that artist. The same entity-resolution problem applies one level down, to the works themselves: matching the same painting across two catalogs, with translated titles and approximate dimensions, is what makes a repeat-sales pairing possible at all.
5. The human review layer and data quality
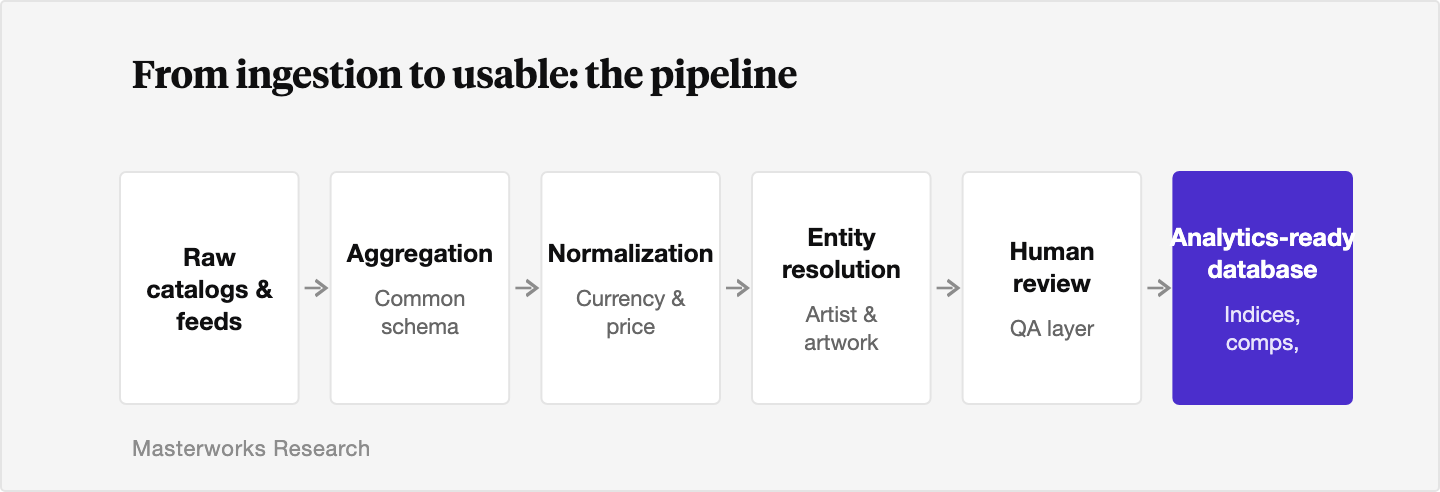
Automation gets you most of the way. People get you the rest, and the rest is where credibility lives. On top of the automated ingestion sits a human review layer, and it exists because the edge cases that break automated matching are exactly the high-value records you cannot afford to get wrong.
The workflow is tiered. High-confidence matches are accepted automatically. Obvious non-matches are rejected automatically. The ambiguous cases, an artist with a common surname and no birth year, a possible-but-uncertain match between the same work at two houses, an unusual medium that does not fit the standard categories, route to expert reviewers. Their decisions are not just one-off fixes. They become labeled training data that feeds back into the matching models, so the system gets better at the next ambiguous case [5].
Quality assurance runs alongside the matching. Sample audits estimate the error rate in artist linking, deduplication, and currency conversion. Consistency checks catch the impossible, an artist born after the sale date, a price that is off by a factor of a thousand because a currency was misread. Deduplication separates a record that was ingested twice from a work that genuinely sold twice, which is a distinction that matters enormously, because the first is an error and the second is the raw material of a return. This is the layer that turns "50M+ records" from a count into a claim you can stand behind. Masterworks describes its total research corpus as [50M+ records], and the bracket is deliberate; it is the firm's stated figure, grounded in the verified counts above rather than asserted as an independent audit.
6. What a usable database unlocks: indices, comps, and models
A clean database is not the product. It is what makes the products possible, and there are three.
The first is an index. We build the Masterworks Post-War and Contemporary Art Index using a repeat-sales methodology, the same approach Robert Shiller pioneered for home prices with the Case-Shiller index. Rather than averaging a basket of different works, you track the same work across multiple sales and let the change in price isolate pure appreciation. That method is only feasible if your entity resolution is good enough to reliably match a work to its earlier self, which is precisely the engineering described above. The method's known limits, survivorship bias and the exclusion of unsold lots, are real; most public art indices leave unsold work out entirely [3], and in weak markets unsold lots can exceed half of those offered [8]. A usable database does not erase those limits. It makes them visible, so they can be measured and adjusted for. We work through this in detail in how reliable are repeat-sales indices for art.
The second is the comparable. When an appraiser or an underwriter values a work, they reach for recent sales of similar works by the same artist. The quality of that comparable depends entirely on whether the database has correctly resolved the artist, normalized the prices, and standardized the medium and dimensions. We cover the mechanics in comparable sales analysis for art: how appraisers build price estimates.
The third is the model. Hedonic regression decomposes a price into the value of its characteristics, artist, medium, size, period, and a time effect for the market, and machine-learning models extend that logic [5]. Researchers consistently find that the strongest predictors are historical and identity-based signals, which puts a premium on clean artist resolution and accurate prior-sale prices [4]. A model trained on messy data learns the mess. We explain the underlying method in hedonic regression in art pricing: how characteristics drive value.
In our view, this is the inefficiency worth attacking. Most large asset classes have sophisticated participants competing on data quality. The art market historically did not, which is why building the database was both the hardest part and the most durable advantage. Past performance is not predictive of future results, and a database measures the past. What it buys you is the ability to measure it honestly.
The Bottom Line
- Raw auction records are public and centuries deep, but they are published house by house, in many formats and currencies, with no shared identifier for artists or works, so they require substantial engineering before they are usable.
- Coverage means aggregating thousands of fragmented sources; the Masterworks research database spans more than 1.2 million auction lots from over 6,000 houses and more than 130,000 artists, with prices recorded in 124 currencies converted to USD at sale-date rates.
- Artist-name entity resolution is the central problem; a large share of names standardize automatically and the remainder, plus duplicate works and messy historical records, run through a human review layer that also retrains the matching models.
- A usable database is what makes repeat-sales indices, defensible comparables, and machine-learning price models possible, and it makes the known limits of auction data, survivorship bias and the exclusion of unsold lots, visible rather than hidden.
- Masterworks describes its total research corpus as [50M+ records]; the verified scale figures cited here are the firm's, and past performance is not predictive of future results.
Sources
- Masterworks Research. "Reading the Tape: Auction Estimates in the Art Market." Masterworks Academy, June 2026. (Cites Art Basel & UBS Global Art Market Report 2026, Dr. Clare McAndrew: 2025 public auction sales approximately $20.7bn.)
- Perplexity Research summary citing 2024 Sotheby's annual review and Christie's company history; global auction market fragmentation and artist counts. Accessed June 20, 2026. https://www.sothebys.com
- Morgan Stanley. "Art Market Indexes: How They Work." Morgan Stanley, February 9, 2026. https://www.morganstanley.com/articles/art-market-indexes
- Aubry, M., Kraussl, R., Manso, G., and Spaenjers, C. "Predicting Prices in the Art Auction Market" (neural networks applied to one million painting auctions). HAL open archive. https://hal.science/hal-02896049/
- Various. "Machine Learning Algorithms and Fine Art Pricing." Expert Systems with Applications (ScienceDirect), April 25, 2025. https://www.sciencedirect.com/science/article/abs/pii/S0957417425000909
- Morgan Stanley. "Art Market Indexes: How They Work" (Artnet Price Database: more than 1,800 auction houses and 340,000 artists). Morgan Stanley, February 9, 2026. https://www.morganstanley.com/articles/art-market-indexes
- Art Media Agency / Art Market Research. "Art market indices" (AMR founded 1978; index methodology). September 4, 2025. https://en.artmediaagency.com/5bd6f342e536e644f7037481ae31bd79
- Center for Art Law. "Art Price Indices: Op Ed" (unsold lots could exceed 50% of those presented at auction). Center for Art Law. https://itsartlaw.org/art-law/art-price-indices-op-ed/
- Locatello, C. et al. "Constructing the true art market index: A novel 2-step hedonic approach" (Artnet coverage: over 500 international auction houses since 1985, more than 3.5 million artworks). EconStor. https://www.econstor.eu/bitstream/10419/25546/1/577545752.PDF
- Stanford CS230. "The Art of Predicting Art Auction Price" (deep learning on auction features and images). 2019. https://cs230.stanford.edu/projects_fall_2019/reports/26261328.pdf
- arXiv. "Deep Learning for Art Market Valuation." December 28, 2025. https://arxiv.org/html/2512.23078v1
- New York Public Library. "Art Online Resources: Art Prices and Auctions" (overview of auction databases and their coverage). NYPL Library Guides, updated June 18, 2026. https://libguides.nypl.org/c.php?g=1529372&p=11457120
Disclosures
Investing involves risk. Past results are not indicative of future outcomes.
Masterworks is providing this communication as an agent for its issuer entities, not Masterworks Advisers. This material is produced by Masterworks for informational purposes only and does not constitute investment advice, a recommendation, or an offer or solicitation to buy or sell any security. Masterworks is not a licensed broker-dealer by the SEC or FINRA.
Masterworks can only make and accept sales after an offering statement has been filed, and "qualified", by the SEC. Any offers may be revoked before notice of qualification. Indications of interest involve no obligation. For further disclosure visit the offering documents filed with the SEC and Important Disclosures at masterworks.com/cd.
Forward-looking statements and internal estimates are based on assumptions that may prove incorrect, and actual outcomes may differ materially. Figures denoted in brackets are subject to confirmation. Investing in art and alternative assets involves risk, including loss of principal.
Art sales price data is comparative only. Each painting is unique and historical data is not a direct proxy for any specific painting or investment. Data represents whole art, not an investment into our offerings which includes fees and expenses. Any comparative images are not currently live offerings and are provided for educational purposes only.
Masterworks, LLC is located at 1 World Trade Center, 57th Floor, New York, NY 10007.