Masterworks Research · June 2026
Why the repeat-sales method is the best tool we have for measuring art, and the four limits every investor should price in before trusting one.
A repeat-sales index measures art by tracking the same work across two or more sales and reading the change in price, the same method Robert Shiller used to build the Case-Shiller home price index. It is the most defensible way to measure an asset where no two items are alike, and we build our own index this way. It is also not perfect. The same design that makes it clean, comparing a work only to itself, introduces selection bias, thin-sample noise, and a quality assumption that art quietly violates. For an investor, the question is not whether to trust an art index, but how much to trust it and where to discount it.
What You Need to Know
- Repeat-sales is the gold standard, for a reason. By tracking the same Warhol across its 2015 and 2025 sales, the method strips out the work's fixed traits and isolates pure market movement, without needing to model what makes one painting worth more than another.
- Selection bias is the biggest threat. Owners tend to bring winners back to market and quietly hold losers. A selection-corrected study found this pushed measured art returns down from 8.7% to 6.3% a year and cut the Sharpe ratio from 0.27 to 0.11 [1]. We cover that in depth in a companion piece.
- Thin trading makes the numbers noisy. Art resells rarely and at long, irregular intervals, so any single period rests on relatively few matched pairs. The variance of a measured price change grows with the holding period, which is why serious indices weight long gaps down [2][3].
- The alternatives trade one flaw for another. Hedonic indices use every sale but must model quality explicitly. Appraisal-based indices give a smooth series but lag the real market and understate risk. There is no free lunch in art measurement.
1. What a repeat-sales index actually measures
Start with the problem it solves. A stock index is easy because every share of a company is identical. Art is the opposite. Every work is unique, so you cannot simply average this year's prices against last year's and call the difference appreciation. You would just be measuring which paintings happened to sell.
The repeat-sales method, first set out by Bailey, Muth and Nourse in 1963 for housing, gets around this by comparing a work only to itself [4]. You find items that sold at least twice, take the change in log price between each pair of sales, and regress those changes on time. Because the same object sits on both sides of the comparison, every fixed trait it has, the artist, the size, the subject, drops out. What is left is the part you want: how much the market moved between the two dates.
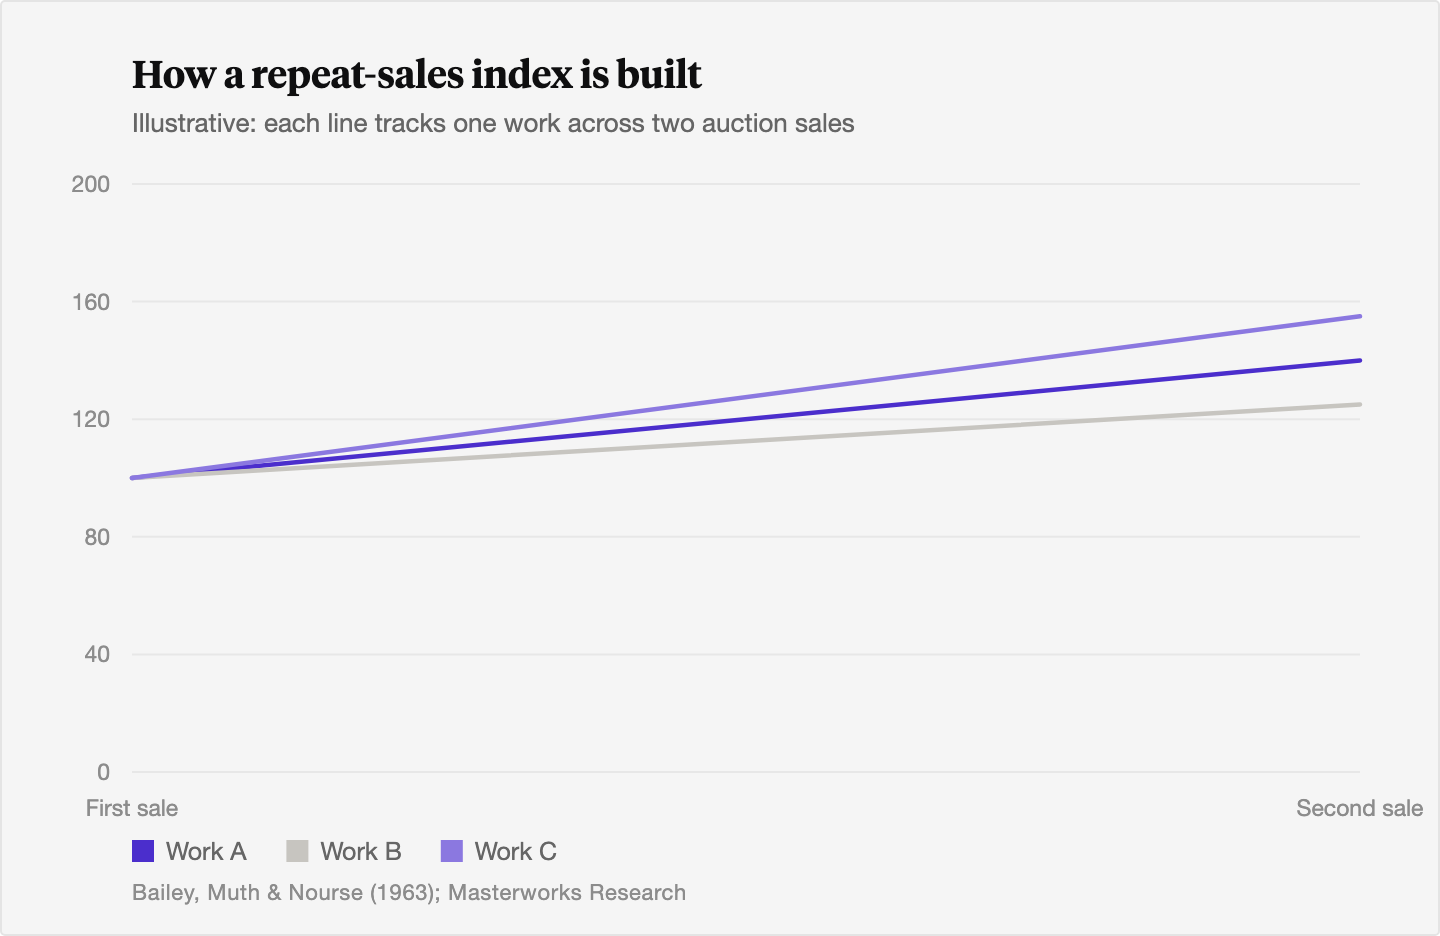
When the same Warhol sells in 2015 and again in 2025, the change in its price tells you something real about the Warhol market, in a way that comparing two different Warhols never could. That is the whole appeal.
2. Why repeat-sales became the standard
The method moved from housing into art through a few academic steps that are worth knowing, because they are also where the credibility comes from.
Karl Case and Robert Shiller refined the approach for US home prices in the late 1980s, adding a weighting scheme to handle the fact that price changes measured over longer gaps are inherently noisier [2][5]. That became the S&P Case-Shiller index. William Goetzmann then carried the method into art in his 1993 paper "Accounting for Taste," using centuries of auction records to estimate long-run art returns [6]. Jianping Mei and Michael Moses built the best-known commercial version, the Mei Moses index, on the same repeat-sales foundation in their 2002 study, later acquired by Sotheby's [7].
We build the Masterworks Post-War and Contemporary Index the same way, and we hold it to the same scrutiny we are about to apply to everyone else's. A method does not become reliable because we use it. It becomes reliable when you understand exactly how it can mislead and correct for that.
3. The selection problem: who decides to resell
Here is the limitation that matters most, and the one most casual readers of an art index never consider. A repeat-sales index can only see works that come back to market. The decision to resell is not random.
Owners tend to bring their winners back to auction and hold, or quietly dispose of, their disappointments. If the works that resell are disproportionately the ones that did well, the index is built from a sample tilted toward success, and it overstates how the average work performed. Korteweg, Kraussl and Verwijmeren measured this directly in a 2016 study of nearly 33,000 repeatedly sold paintings. Correcting for the selection effect cut the estimated annual return from 8.7% to 6.3% and the Sharpe ratio from 0.27 to roughly 0.11 [1]. That is a large adjustment, and it comes entirely from who chooses to sell, not from any error in the price data.
This is important enough that we treat it on its own. See our companion piece on how sample selection bias distorts published art returns. The takeaway here is narrower: a repeat-sales index is only as representative as its resale sample, and that sample is shaped by human decisions that favor good news.
4. The constant-quality assumption art quietly breaks
The method's elegance rests on one assumption: the work is the same object at both sales. For houses, renovations and decay already strain that. For art, it breaks in ways that are specific and consequential.
A painting can be cleaned, restored, or relined between sales, raising its value for reasons that have nothing to do with the market. Scholarship moves: a work can be upgraded from "attributed to" to "by the artist," or added to the catalogue raisonne, which can multiply its price. None of that is market appreciation, but a repeat-sales index reads it as exactly that. The reverse happens too. Damage or a downgrade in attribution shows up as market weakness when it is really a change in the asset. Mei and Moses flagged this directly, noting that extreme cases can be screened by hand but many quality changes are simply unobservable [7].
Related is the masterpiece effect, the finding from the same Mei and Moses work that the highest-priced pieces have tended to underperform the broader market on a return basis [7]. If an index is dominated by a handful of expensive, frequently traded trophies, it can quietly track a segment that behaves differently from the market as a whole. We wrote about how different price bands behave in our price tier analysis.
5. Thin trading and the noise problem
Houses turn over every several years. Art can sit in a collection for decades. The 3 D's, death, divorce, and debt, still drive much of the supply that does appear. That scarcity of transactions has two effects on an index.
First, any single period is estimated from relatively few matched pairs, so the reading is noisier and more sensitive to a few outsized results than an equity index ever would be. Second, the longer and more variable the gap between two sales, the wider the range of things that could have moved the price, which is the heteroskedasticity that Case and Shiller built their weighting scheme to handle [2][3]. A naive index that ignores this produces tidy-looking numbers with misstated confidence. For a narrow slice, a single artist or a single medium, the sample can get so thin that the index is fragile and should be read as a direction rather than a precise figure.
6. Repeat-sales versus hedonic versus appraisal-based
If repeat-sales has these flaws, why not use something else? Because the alternatives carry their own.
A hedonic index uses every sale, not just resales, and controls for a work's measured characteristics. That sidesteps the resale-selection problem, but it forces you to model quality explicitly, and art has crucial qualities no spreadsheet captures. We covered that approach in hedonic regression in art pricing. An appraisal-based index leans on periodic valuations rather than sales, which produces a smooth, regular series even when transactions are scarce. The cost is that appraisals lag the real market and anchor on the past, so the index understates volatility and reports turning points late. That smoothing can make an asset look less risky and less correlated than it truly is, a problem we discuss in appraisal lag.
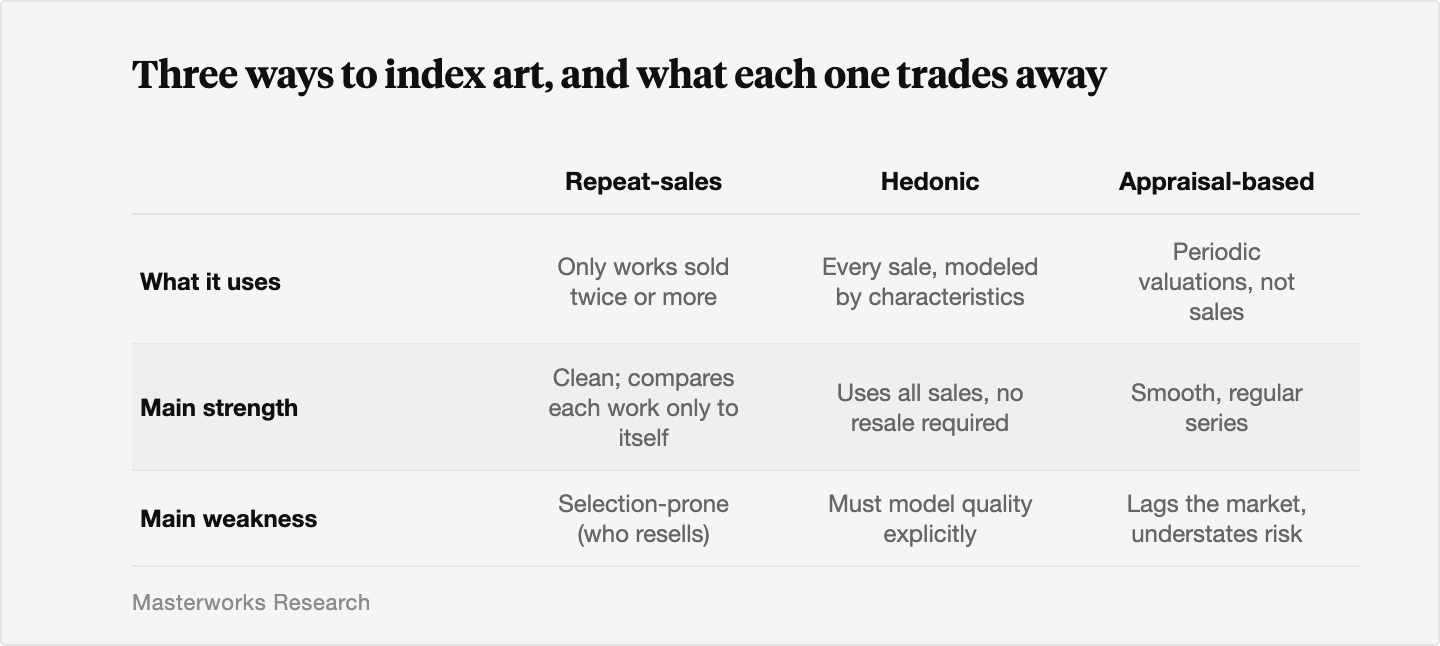
The honest position is that repeat-sales is the best available method for measuring pure price movement, and that it should be read with its limits in view. We use it because the alternatives are weaker on the dimension that matters most, isolating real market change, not because it is flawless.
7. How to read a repeat-sales index as an investor
A few practical rules follow from all of this. Treat an art index as a measure of direction and rough magnitude, not as a price you can transact at. Trust the aggregate more than the slivers: a broad index built on many thousands of pairs is far more reliable than a single-artist sub-index built on a few dozen. Assume reported returns sit at the optimistic end before any selection correction, and discount accordingly. And give the most weight to indices whose builders are explicit about their method and their biases. An index that publishes its construction is doing the one thing that makes the number worth using.
The Bottom Line
- Repeat-sales is the most defensible way to measure art because it compares each work only to itself, which removes the fixed-quality differences that make art impossible to average.
- The method's central weakness is selection: owners resell winners more than losers, and correcting for that has been shown to cut measured art returns by more than two percentage points a year and roughly halve the Sharpe ratio.
- Art also violates the constant-quality assumption through restoration and re-attribution, and trades too thinly to give precise period-by-period readings, especially for narrow segments.
- Hedonic and appraisal-based indices solve some of these problems and create others, so there is no method that is clean on every dimension.
- Read any art index as direction and approximate magnitude, favor broad indices over thin sub-indices, and assume raw returns are flattering until shown otherwise. Past performance is not predictive.
Sources
- Korteweg, Arthur, Roman Kraussl, and Patrick Verwijmeren. "Does It Pay to Invest in Art? A Selection-Corrected Returns Perspective." Review of Financial Studies 29, no. 4 (2016): 1007 to 1038. https://academic.oup.com/rfs/article-abstract/29/4/1007/1896045
- Case, Karl E., and Robert J. Shiller. "The Efficiency of the Market for Single-Family Homes." American Economic Review 79, no. 1 (1989): 125 to 137. https://www.jstor.org/stable/1804778
- Federal Housing Finance Agency. "A Comparison of House Price Indexes" (working paper). https://www.fhfa.gov/document/wp2101.pdf
- Bailey, Martin J., Richard F. Muth, and Hugh O. Nourse. "A Regression Method for Real Estate Price Index Construction." Journal of the American Statistical Association 58, no. 304 (1963): 933 to 942. https://www.tandfonline.com/doi/abs/10.1080/01621459.1963.10480679
- Case, Karl E., and Robert J. Shiller. "Prices of Single-Family Homes Since 1970: New Indexes for Four Cities." New England Economic Review, September 1987. https://www.bostonfed.org/publications/new-england-economic-review/1987-issues.aspx
- Goetzmann, William N. "Accounting for Taste: Art and the Financial Markets Over Three Centuries." American Economic Review 83, no. 5 (1993): 1370 to 1376. https://www.jstor.org/stable/2117574
- Mei, Jianping, and Michael Moses. "Art as an Investment and the Underperformance of Masterpieces." American Economic Review 92, no. 5 (2002): 1656 to 1668. https://www.aeaweb.org/articles?id=10.1257/000282802762024719
- Investopedia. "Repeat-Sales Method." Accessed June 2026. https://www.investopedia.com/terms/r/repeatsales-method.asp
- Korteweg, Arthur, Roman Kraussl, and Patrick Verwijmeren. "Does It Pay to Invest in Art?" Stanford GSB working paper. https://www.gsb.stanford.edu/faculty-research/working-papers/does-it-pay-invest-art-selection-corrected-returns-perspective
- Wharton Real Estate. "Repeat-Sales and Hedonic House Price Indexes" (working paper). https://realestate.wharton.upenn.edu/wp-content/uploads/2017/03/724.pdf
- Art Basel and UBS. "The Art Market 2025." Art Basel, 2025. https://theartmarket.artbasel.com/the-art-market-2025/global-market
Disclosures
Investing involves risk. Past results are not indicative of future outcomes.
Masterworks is providing this communication as an agent for its issuer entities, not Masterworks Advisers. This material is produced by Masterworks for informational purposes only and does not constitute investment advice, a recommendation, or an offer or solicitation to buy or sell any security. Masterworks is not a licensed broker-dealer by the SEC or FINRA.
Masterworks can only make and accept sales after an offering statement has been filed, and "qualified", by the SEC. Any offers may be revoked before notice of qualification. Indications of interest involve no obligation. For further disclosure visit the offering documents filed with the SEC and Important Disclosures at masterworks.com/cd.
Forward-looking statements and internal estimates are based on assumptions that may prove incorrect, and actual outcomes may differ materially. Figures denoted in brackets are subject to confirmation. Investing in art and alternative assets involves risk, including loss of principal.
Art sales price data is comparative only. Each painting is unique and historical data is not a direct proxy for any specific painting or investment. Data represents whole art, not an investment into our offerings which includes fees and expenses. Any comparative images are not currently live offerings and are provided for educational purposes only.
Masterworks, LLC is located at 1 World Trade Center, 57th Floor, New York, NY 10007.