
Masterworks Research · June 2026
How a power-law return profile, the J-curve, and a high access bar shape venture capital, and what that means for investors thinking about diversifying beyond public markets.
Venture capital is private equity invested in early-stage, high-growth private companies, usually through a fund that pools money from outside investors and is run by a manager who picks the deals. The returns follow a power law: in the data, most companies in a fund return less than the money put in, and a small handful of winners produce nearly all of the gains. One credited dataset found that roughly 6% of investments drove about 60% of the total dollar returns [1][2]. For an investor evaluating where to put money beyond stocks and bonds, that math is the whole story, because it explains why VC can compound at high rates over a decade and why most investors never see those rates.
What You Need to Know
- Returns concentrate in a few winners. In the Horsley Bridge dataset that Sebastian Mallaby analyzes in The Power Law, about 6% of investments generated roughly 60% of total returns, and many funds had a single deal that returned the entire fund or more [1][2]. Most companies lose money.
- Most individual bets fail. Correlation Ventures data on thousands of US financings show roughly two-thirds of venture investments return less than the capital invested, with outright zeros common [1][3]. AngelList found the top 1% of deals on its platform drove the majority of all gains [4].
- The J-curve means early losses by design. A VC fund usually shows negative net returns for the first three to five years because fees are charged on committed capital before any company is sold, and weak deals are written down before winners revalue [5][6]. Returns turn positive later, if they turn at all.
- Manager selection decides almost everything. Across mature vintages, top-quartile VC funds have delivered net IRRs near 20% to 30%, while the median sits closer to 8% to 15%, a gap of 10 to 15 percentage points [7]. The average VC return and the VC return most investors can actually access are not the same number.
- Access is the binding constraint. Direct commitments to strong funds typically start at $1 million to $5 million and require accredited or qualified-purchaser status, and the best funds are oversubscribed by large institutions [8]. Money is locked up for 10 years or longer.
1. What venture capital is and how a VC fund works
Venture capital funds money into private companies that are too young, too risky, or too unproven to raise from public markets or a bank. In return the fund takes equity, an ownership stake, and waits for the company to be sold or go public.
The money runs through a structure worth understanding, because it shapes the returns. A venture capital fund is almost always a closed-end limited partnership [8]. The limited partners, or LPs, supply the capital. These are pensions, endowments, foundations, family offices, and a small number of wealthy individuals. The general partner, or GP, is the venture firm itself. The GP picks the companies, sits on boards, and decides when to sell. The LPs are passive.
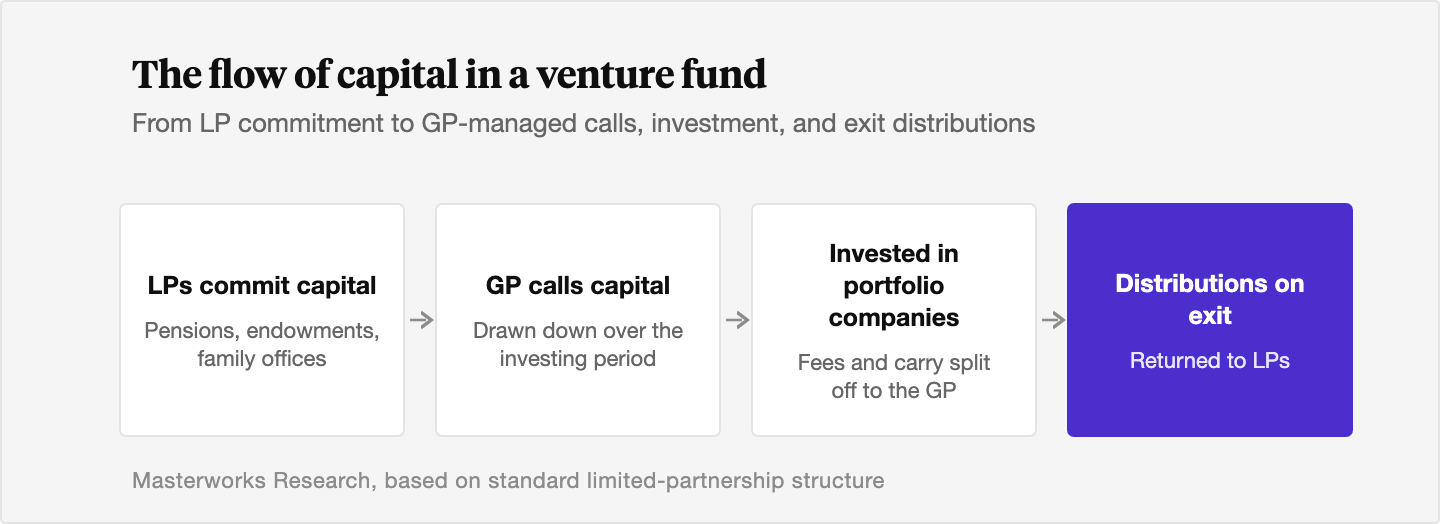
LPs do not hand over the full amount on day one. They make a commitment, say $25 million, and the GP draws it down over several years through capital calls as deals come up [8]. The fund has a finite life, typically 10 years with two optional one-year extensions, structured as roughly a three-to-five-year investing period followed by a harvest period when companies are sold [8]. That clock matters. A fund has to find its winners, hold them, and exit them inside a fixed window.
2. How VC returns work: the power law
Here is the part most investors miss. Venture returns are not a bell curve around an average. They follow a power law, where a tiny fraction of outcomes dominate everything else.
The data is consistent across sources. Correlation Ventures, looking at thousands of US venture financings, found that roughly 65% of investments returned less than the capital put in, while only about 5% to 7% of deals returned more than 10 times the money [1][3]. AngelList, analyzing tens of thousands of early-stage deals on its platform, described a fairly extreme power-law distribution where the top 1% of investments generated the majority of all gains and the median investment lost money [4].
The cleanest single number comes from Horsley Bridge, a large fund-of-funds, whose anonymized data Sebastian Mallaby used in The Power Law. In that dataset, about 6% of the investments produced roughly 60% of the total dollar returns [1][2]. That is far more skewed than the familiar 80/20 rule. Many funds in the data had one company that returned the entire fund or more, with everything else netting out to roughly breakeven [2].
Translate that into investing terms and the logic flips. A venture portfolio is not built to have a high win rate. It is built to own a piece of the rare company that returns 50 or 100 times, because that one position can carry the fund while the majority of the names go to zero. That is why a strong VC fund and a strong stock portfolio look nothing alike under the hood.
3. The J-curve: why VC returns start negative
A VC fund usually loses money on paper before it makes any. Plotted over time, the cumulative net return dips into negative territory in the early years and then, if the fund works, climbs back above zero and keeps rising. The shape traces a letter J [5][6].
Two mechanics drive the dip. First, fees come before returns. A fund charges its management fee on committed capital from inception, even though only a fraction of the money has been invested in those first years [5][6]. The LP is paying on the full commitment while the GP is still hunting for deals. Second, weak investments get written down early. Failing companies are marked down or written off while the winners are still private and carried at cost, so the reported value sinks before it recovers [5][6].
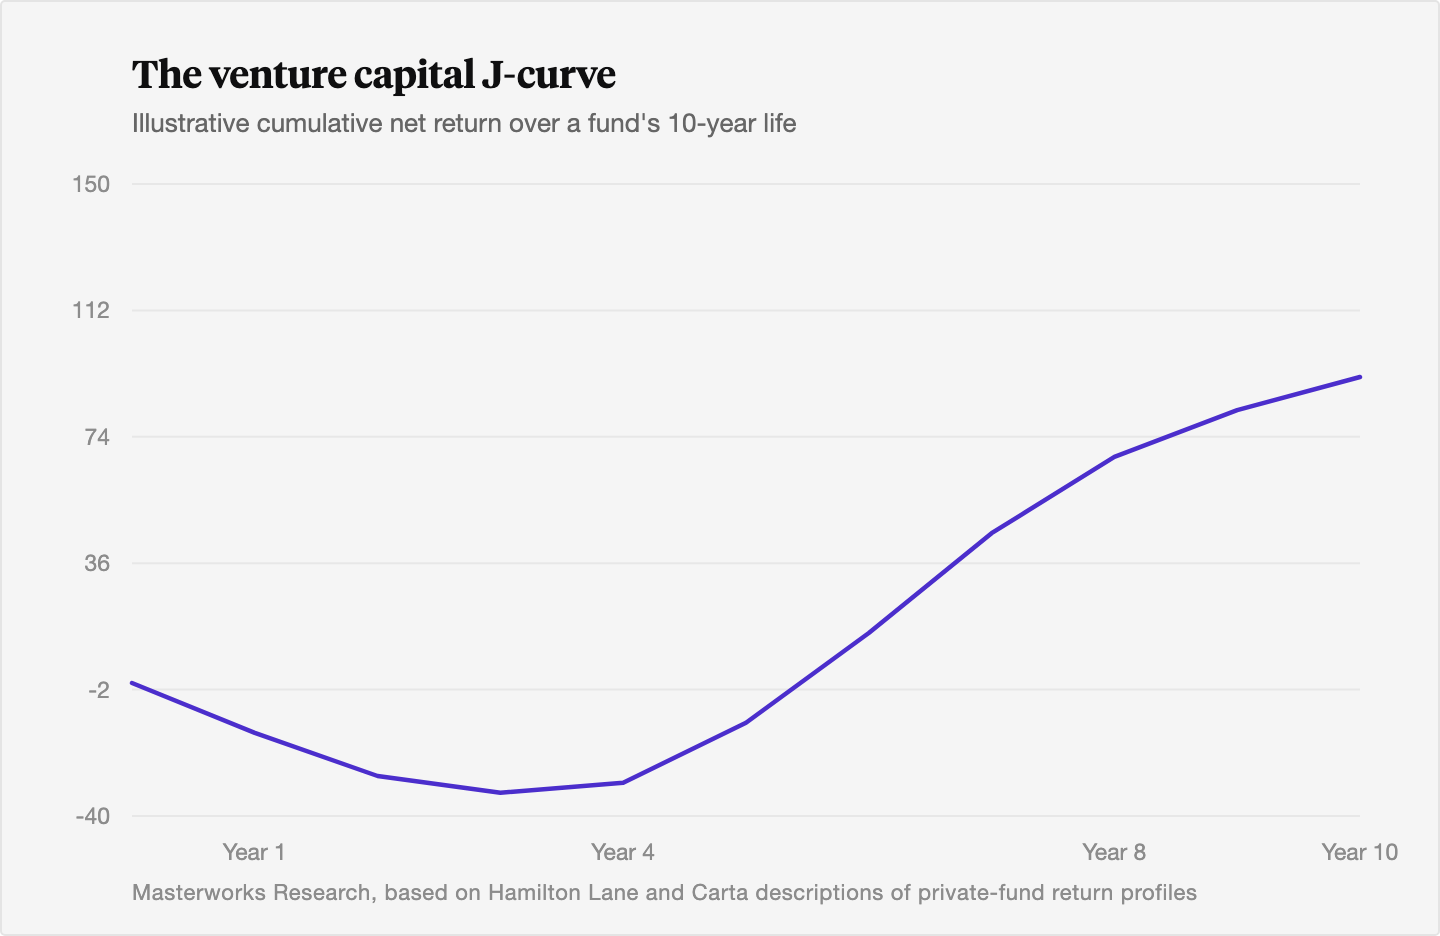
The negative phase commonly runs about three to four years, with the curve turning up as companies mature and exits begin around years five through eight [6]. In venture specifically the trough can be deeper and longer than in buyout funds, because startups need multiple follow-on rounds and many years before an exit, and early valuations swing hard [5]. An LP who looks at a young fund and sees a loss is usually looking at the J-curve, not at failure. The honest point is that the curve only turns up for funds that find their winners. For the rest it stays down.
4. Vintage years and why timing the fund matters
The year a fund starts investing is called its vintage year, and it carries a lot of weight. Vintage captures the market a fund bought into and the market it later sold into [5]. A fund that deployed at the top of a cycle paid high entry prices. A fund that deployed into a dislocation bought cheaper and often did better.
Cambridge Associates, Preqin, and PitchBook all benchmark funds by vintage for exactly this reason, comparing like with like [5]. The dispersion across vintages is wide, and the dispersion within a single vintage is wider still. Across major datasets, the gap between top-quartile and bottom-quartile funds of the same vintage often exceeds 1,000 to 2,000 basis points of net IRR [5]. Same era, same opportunity set, vastly different outcomes.
For an investor, the lesson that LPs already follow is to spread commitments across several vintage years rather than betting on one [5]. You cannot reliably pick the good vintage in advance, so you stagger entry and let the timing average out.
5. The 2 and 20 fee structure and what LPs actually keep
Venture funds run on a fee model shorthanded as 2 and 20. The 2 is the annual management fee, historically around 2% of committed capital, though a 2023 industry review put the average closer to 1.74% during the investing period before it steps down [8]. The 20 is carried interest, the GP's share of the profits, usually 20% of gains above a return of capital and often an 8% preferred return to LPs first [8].
The order of payment matters. In a standard waterfall, LPs get their capital back, then their preferred return, then the GP catches up, and only then are remaining profits split 80% to LPs and 20% to the GP [8]. Most LP-friendly agreements include a clawback so the GP has to return excess carry if later deals lose money [8].
The fees compound the dispersion problem. Top-quartile VC funds in mature vintages have delivered net IRRs around 20% to 30%, with the median nearer 8% to 15% and bottom-quartile funds in low single digits or negative territory [7]. Those are net-of-fee figures. The spread between top quartile and median is commonly 10 to 15 percentage points, and the spread to the bottom quartile is often 20 points or more [7]. In our view the practical takeaway is blunt. In venture, the average fund return is not the return most investors get, because most investors do not get into the average fund.
6. The access reality: who can actually invest in VC
Venture capital is one of the harder asset classes to enter. Three barriers stack up.
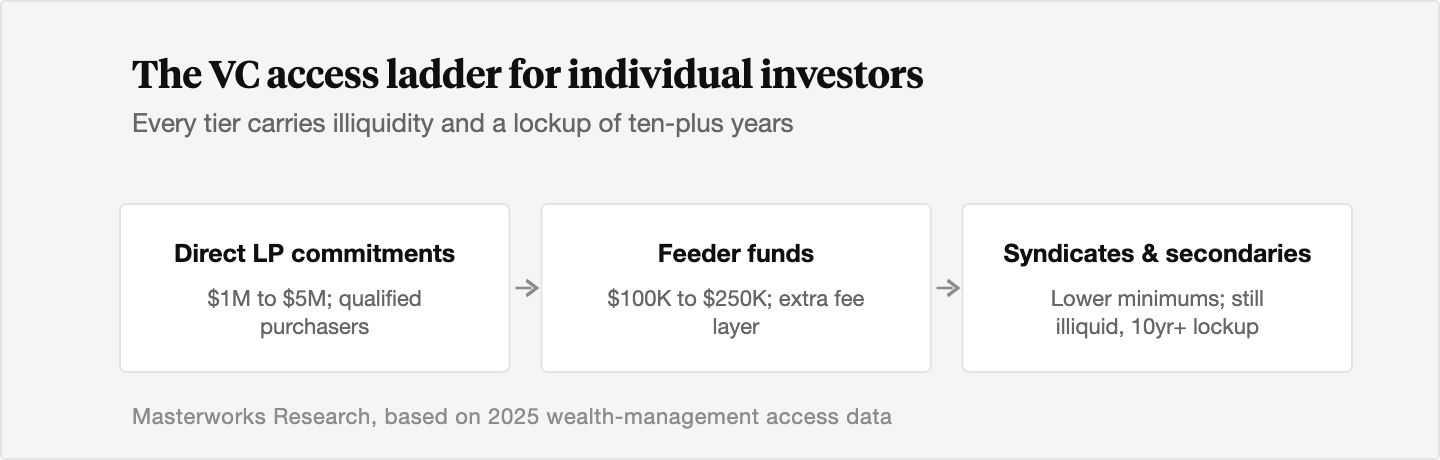
The first is legal. Most US VC funds are sold under private-placement rules that limit them to accredited investors, broadly an individual with income over $200,000 or net worth over $1 million excluding a home [8]. Many top-tier funds use a higher standard and admit only qualified purchasers, individuals with at least $5 million in investments [8]. That alone screens out most people.
The second is ticket size. Direct commitments to compelling funds commonly start at $1 million to $5 million [8]. Feeder funds and funds-of-funds open the door at $100,000 to $250,000, but they layer on a second set of fees [8]. The third is the relationship. The best-known funds are routinely oversubscribed and prioritize the large institutions and long-standing LPs already on their rolls, so a one-off individual investor rarely gets an allocation to a flagship fund at all [8].
The current cycle has made the wait harder. US VC funds raised about $100 billion in a recent year, down roughly 15% year over year [8]. Exits dried up: one 2024 analysis found that 3.6% of exits accounted for 78.9% of total exit value, a near-frozen liquidity market [8]. Distributions back to LPs fell sharply, with many 2018 to 2021 vintage funds showing distributions to paid-in capital well below 0.3 to 0.5 times even years into their lives [8]. New dollars have also concentrated: by 2025, AI accounted for about 61% of the total value of global VC investment, up from 30% in 2022 [8]. Capital is committed for a decade or more, and right now it is coming back slowly.
7. VC and art as ways to diversify beyond public markets
Both venture capital and fine art are ways to put money to work outside stocks and bonds, and investors increasingly weigh them side by side. They behave very differently, and the contrast is the useful part.
Venture is a power-law asset. As the data above shows, most companies fail, a few winners carry the fund, and the outcome hinges on getting into the rare top-quartile manager. The upside in a winning fund is large. The variance is enormous, the money is locked up for 10 years or more, and access to the best funds is gated by wealth thresholds and relationships [4][7][8].
Fine art sits at the other end on variance. Returns concentrate too, in the sense that the top 100 artists make up roughly 64% of the value of the market, and quality drives most of the appreciation. The distribution is far less extreme than venture's winner-take-most pattern. Blue-chip art does not return zero the way a failed startup does. A painting by an established artist is a scarce physical asset whose supply tends to shrink over time as works enter museums, rather than a bet that can go to nothing. Studies put the correlation of fine art returns to the S&P 500 in roughly the 0.1 to 0.3 range, with a reasonable point estimate near 0.2 [9][10]. That low correlation is the diversification case, the same case an LP makes for venture, reached through a different door. The global art market was estimated at about $65 billion to $68 billion in 2024, a fraction of the venture and private-equity pool, which is part of why we have long viewed it as an underexploited asset class [9].
The shared trait is illiquidity. Both art and venture ask an investor to hold for years and to give up the ability to sell on a Tuesday. The difference is the shape of the bet. Venture concentrates risk into a search for outliers. Art's case rests on scarcity, low correlation, and patience across a long hold, a pattern we have written about at /academy/posts/why-patience-is-rewarded-in-art-markets-the-data-behind-long-holds. Neither is a substitute for the other, and past performance is not predictive of future results in either one. For an investor mapping the alternatives, the honest framing is that they solve the diversification problem in opposite ways, and the right weight for each depends on how much variance and how long a lockup the portfolio can carry. For advisors weighing how art fits a client allocation, we lay out a fuller approach at /academy/posts/art-as-an-alternative-allocation-a-framework-for-advisors.
The Bottom Line
- Venture capital invests in early-stage private companies through a fund where outside investors (LPs) supply capital and a manager (GP) picks the deals over a roughly 10-year life.
- VC returns follow a power law: most companies return less than the money invested, and a small group of winners drives the majority of gains, with one dataset showing about 6% of deals producing roughly 60% of returns.
- The J-curve means a fund usually posts negative net returns for the first three to five years as fees hit committed capital and weak deals are written down, before exits turn it positive.
- The gap between top-quartile and median VC funds runs 10 to 15 percentage points of net IRR, so manager selection, and the access to get into a top manager, matters more than the headline average.
- VC and fine art both diversify beyond public markets, but venture concentrates risk into a search for outliers while art's case rests on scarcity, low correlation to equities, and a long hold. Past performance is not predictive in either.
Sources
- The VC Factory. "The Power Law in Venture Capital." thevcfactory.com, 2024. https://thevcfactory.com/power-law-venture-capital/
- GoVC Lab. "The Power Law in VC." govclab.com, August 2023. https://govclab.com/2023/08/09/the-power-law-in-vc/
- Rundit. "Understanding the Venture Capital Power Law." rundit.com, 2024. https://rundit.com/blog/understanding-the-venture-capital-power-law/
- AngelList. "What AngelList Data Says About Power-Law Returns in Venture Capital." angellist.com, 2024. https://www.angellist.com/blog/what-angellist-data-says-about-power-law-returns-in-venture-capital
- Carta. "The J-curve in Private Fund Performance." carta.com, 2024. https://carta.com/learn/private-funds/management/fund-performance/j-curve/
- Hamilton Lane. "J-Curves." hamiltonlane.com, 2024. https://www.hamiltonlane.com/en-us/knowledge-center/j-curves
- Russell Investments. "The J-Curve in Private Equity and How to Potentially Beat It." russellinvestments.com, June 2024. https://russellinvestments.com/content/ri/us/en/insights/russell-research/2024/06/the-j-curve-in-private-equityand-how-to-potentially-beat-it.html
- Alter Domus. "Private Equity Fund Structure." alterdomus.com, 2023. https://alterdomus.com/insight/private-equity-fund-structure/
- Vessel. "How to Unlock Co-Investment Access for Wealth Managers: Complete 2025 Guide." vessel.co, 2025. https://vessel.co/resources/blog/how-to-unlock-co-investment-access-for-wealth-managers-complete-2025-guide
- World Economic Forum. "The Future of Venture Capital 2026." weforum.org, 2026. https://reports.weforum.org/docs/WEF_The_Future_of_Venture_Capital_2026.pdf
- McKinsey & Company. "Global Private Markets Report." mckinsey.com, 2026. https://www.mckinsey.com/industries/private-capital/our-insights/global-private-markets-report
- OECD. "Venture Capital Investments in Artificial Intelligence Through 2025." oecd.org, 2025. https://www.oecd.org/en/publications/venture-capital-investments-in-artificial-intelligence-through-2025_a13752f5-en/full-report.html
- SSRN. "The Arte-Blue Chip Index: Blue-Chip Art as a Financial Asset, 1990 to 2024." papers.ssrn.com, 2024. https://papers.ssrn.com/sol3/papers.cfm?abstract_id=5006931
- Adams Street Partners. "2025 Global Investor Survey." adamsstreetpartners.com, 2025. https://www.adamsstreetpartners.com/insights/2025-global-investor-survey/
Disclosures
Investing involves risk. Past results are not indicative of future outcomes.
Masterworks is providing this communication as an agent for its issuer entities, not Masterworks Advisers. This material is produced by Masterworks for informational purposes only and does not constitute investment advice, a recommendation, or an offer or solicitation to buy or sell any security. Masterworks is not a licensed broker-dealer by the SEC or FINRA.
Masterworks can only make and accept sales after an offering statement has been filed, and "qualified", by the SEC. Any offers may be revoked before notice of qualification. Indications of interest involve no obligation. For further disclosure visit the offering documents filed with the SEC and Important Disclosures at masterworks.com/cd.
Forward-looking statements and internal estimates are based on assumptions that may prove incorrect, and actual outcomes may differ materially. Figures denoted in brackets are subject to confirmation. Investing in art and alternative assets involves risk, including loss of principal.
Art sales price data is comparative only. Each painting is unique and historical data is not a direct proxy for any specific painting or investment. Data represents whole art, not an investment into our offerings which includes fees and expenses. Any comparative images are not currently live offerings and are provided for educational purposes only.
Masterworks, LLC is located at 1 World Trade Center, 57th Floor, New York, NY 10007.


