Masterworks Research · June 2026
How to assemble a holding on investment principles rather than taste alone: get the artist market right first, buy the best example at a discount, size every position, and hold.
Building a collection with investment discipline means treating art the way you would treat any illiquid, idiosyncratic asset class. You size each position so no single work dominates your risk, you diversify across artist markets rather than betting on one name, you buy below an independent estimate of fair value, and you hold for years rather than seasons. The order of operations matters most: choose the artist market first, then find the best available example at the lowest price. For an investor, the distinction between a collection assembled this way and one assembled on personal taste is the difference between owning a portfolio and owning a hobby that happens to cost money.
What You Need to Know
- The artist market comes first. A great painting by an artist whose market is not appreciating tends to stay flat. We treat the choice of artist market as the single most important decision, ahead of which specific work you buy.
- Entry price is a return driver, not a formality. A work an independent team fair-values at $1 million is a different investment at a $700,000 ask than at a $1.3 million ask. Buying below fair value builds in a margin of safety against an opaque, high-cost market.
- Concentration is the main risk inside art. The art market is fragmented into thousands of artist-specific submarkets, and a holding stacked into one name behaves like a single-stock bet. Position sizing across multiple artist markets is how you avoid it.
- Time is part of the strategy. Round-trip auction costs can run roughly 25% to 35%, and selection-corrected academic returns sit near 6.5% nominal a year [4]. Short holds rarely clear those frictions. Art is typically a 3 to 10 year allocation.
- Risk-adjusted return is the right scorecard. Headline appreciation alone is misleading. We think in terms of return per unit of risk, artist by artist, the way an equity investor thinks in Sharpe ratios.
1. Start with the artist market, then the work
Most people approach art the other way around. They fall for a specific painting and work backward to justify it. We run a simple two-step process, and it is worth being explicit about the sequence because the sequence is the discipline.
Step one is choosing the artist market. This is paramount. The best example by an artist whose market is not appreciating will probably wind up not being worth much, so the work itself is the second decision, not the first. Step two is sourcing the best available example at the lowest price in a market we believe is likely to appreciate.
A note on how we make step one. Cultural significance gets used loosely in the art market, so we try to quantify it. Our analysis looks at the gallery that represents an artist, the museums that hold the work, and the collectors who buy it, because those signals correlate with future price behavior. The point is to convert a soft judgment into something you can measure and compare across markets.
The order also explains why we segment by era. Across our data, the older art gets, the less it tends to appreciate, which surprises most people. Our best hypothesis is that appreciation follows fashion, and fashion moves generationally. As Masterworks' stated estimates, Contemporary art (post-1970) has appreciated at roughly 12% to 13% a year, Modern at 8% to 9%, Impressionist at 6% to 7%, and Old Masters at 1% to 2% [10]. If you are going to spend seven figures on a painting, you probably want a Basquiat over your sofa, not a Rembrandt. Past results are not indicative of future outcomes, and these segment figures are estimates rather than guarantees.
2. A, B, and C examples: why quality within a market is not optional
Once you have the artist market right, the second decision is which work. Inside a single artist's body of work, quality is not a spectrum of small differences. It is closer to a step function.
We sort works loosely into A, B, and C examples. An A is a major, fully realized, well-provenanced work. A B is a strong secondary work. A C is a minor or compromised piece, a late repetition, a work on paper that the artist treated as an afterthought, a canvas with condition problems. In our experience, A and B examples tend to appreciate at broadly similar rates, while C examples often do not appreciate at all. A Picasso napkin drawing can sit flat for decades while his major canvases climb.
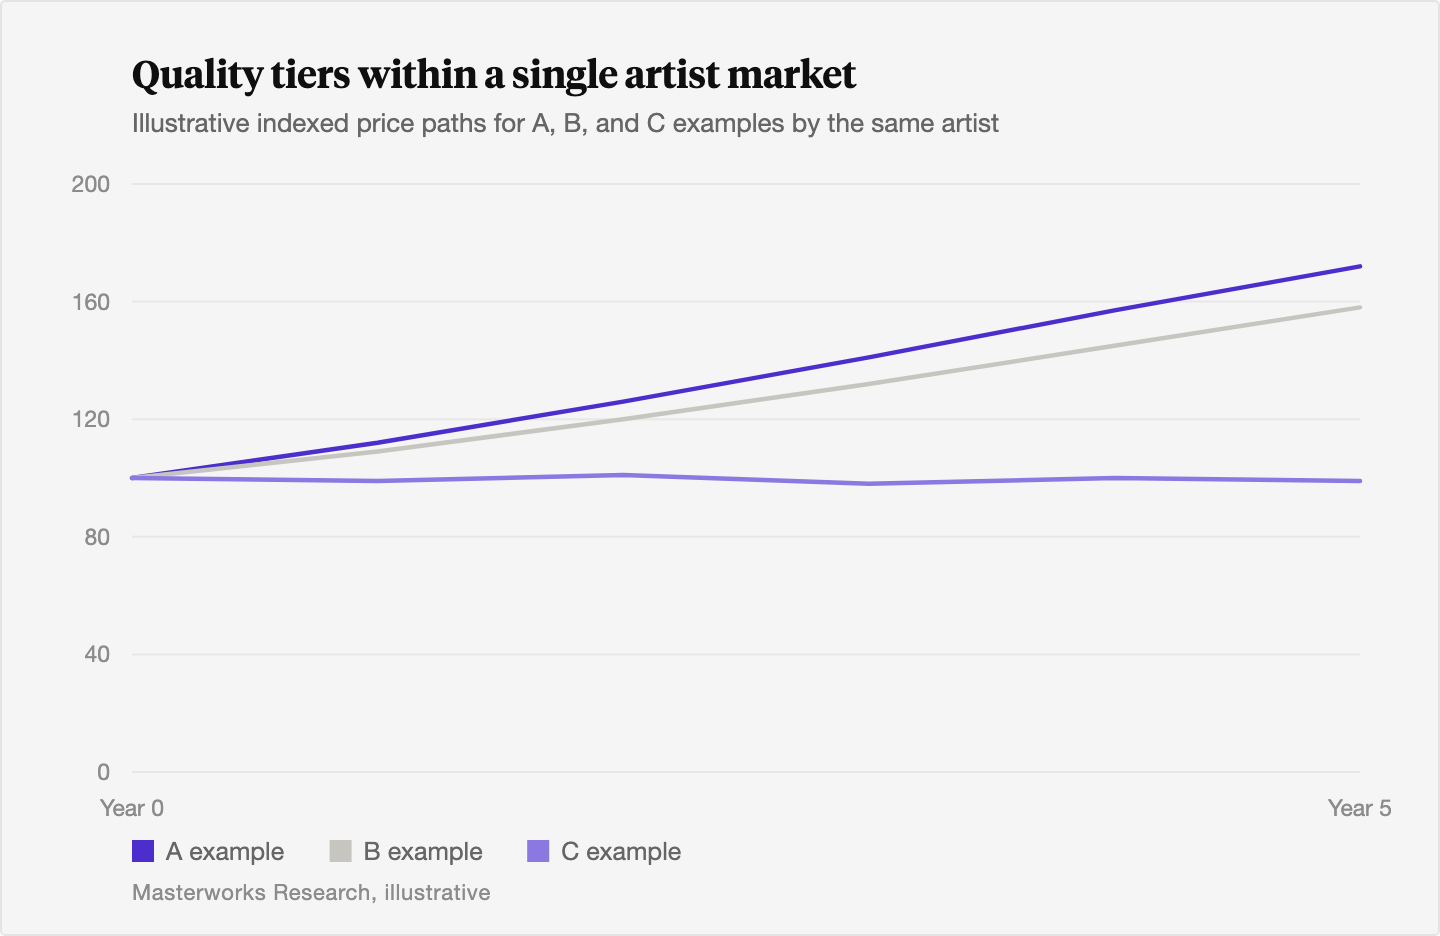
This is why "buy the best example" sits inside the framework as a hard rule rather than a preference. A discount on a C work is not a margin of safety. It is a discount you may never recover.
3. Entry price discipline: fair value versus the ask
In an efficient market, price discipline barely matters, because the price already reflects the value. The art market is not efficient, which is exactly why entry price is a return driver you can control.
The discipline is straightforward. Our team estimates a fair value for a work using comparable sales, condition, provenance, and the artist's market trajectory. Then we compare that estimate to the ask. If we believe a market is appreciating at roughly 12% a year, and we fair-value a work at $1 million, buying it at $700,000 is a good deal. Buying the same work at $1.3 million is not, no matter how much we like the painting.
This margin of safety does real work because the frictions are large. Buyer's premiums at major houses commonly run in the 20% to 25% range on the hammer price, and seller's commissions add several points more, so round-trip transaction costs of 25% to 35% are common [4][6]. Against selection-corrected long-run art returns near 6.5% nominal a year [4], an entry at fair value or above can take years just to break even. An entry below fair value starts the clock with a cushion.
A related discipline is honesty about our own estimates. Independent valuation is not a precise science, and we treat our internal valuation work as historically more accurate than auction-house presale estimates by an estimated [~5%] on an in-range basis, a figure we cite with a methodology caveat and subject to confirmation. Even a good fair-value estimate is a range, not a point.
4. Position sizing and the danger of single-artist concentration
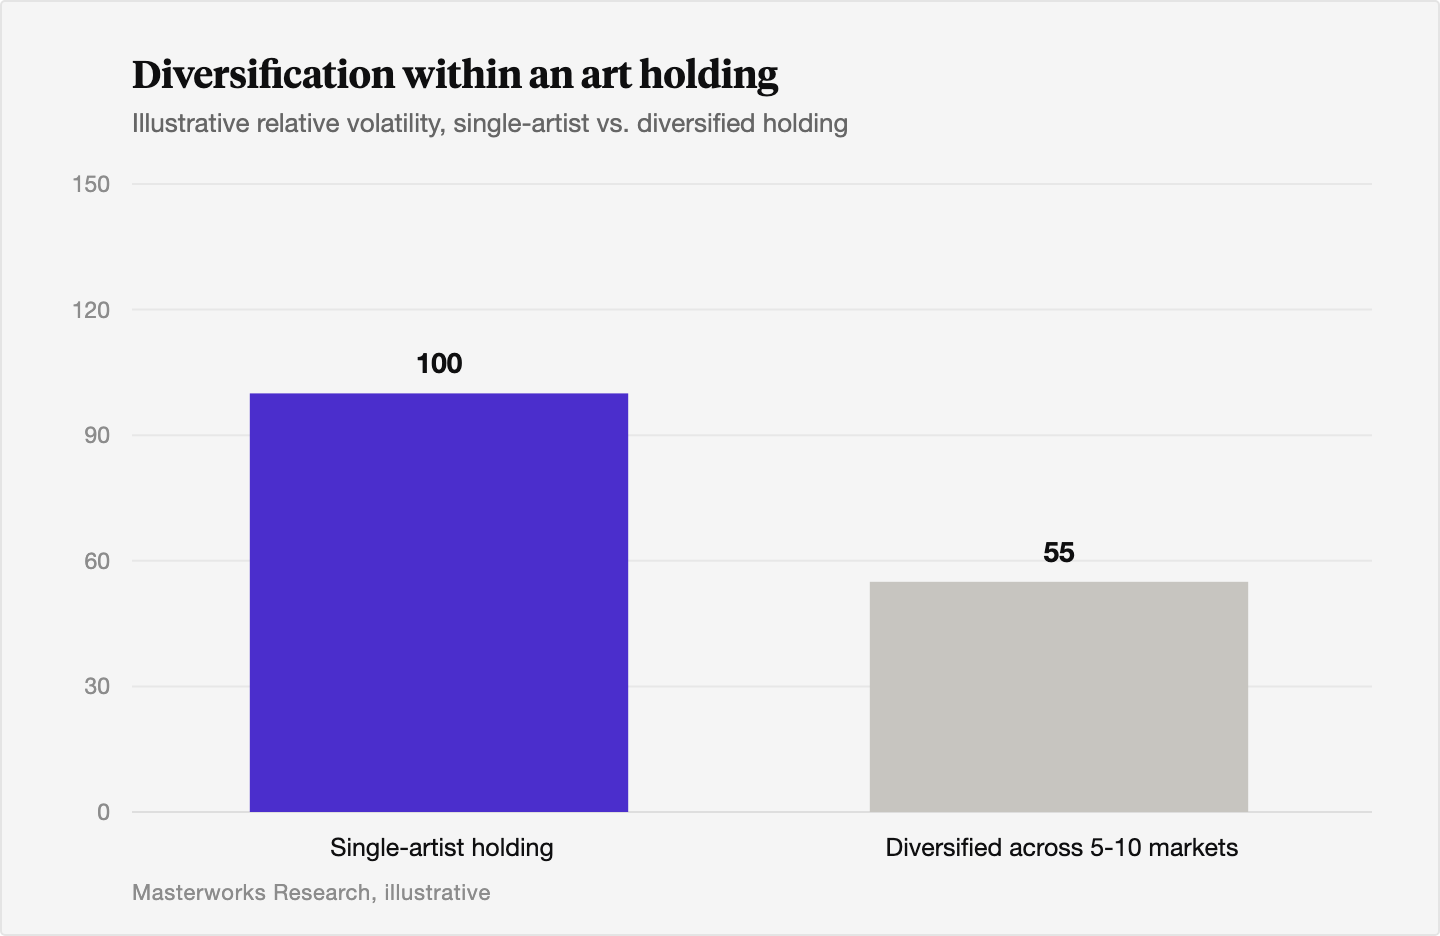
The most common mistake a disciplined investor still makes in art is concentration. It is easy to find one artist market you believe in and put everything there. That is a single-stock bet wearing a frame.
The structure of the market makes the risk concrete. Art is fragmented into thousands of artist-specific and genre-specific submarkets, and there is no broad index you can buy to own the whole thing the way you can own the S&P 500. Morgan Stanley's wealth commentary makes the same point from the advisory side, noting that art has to be managed artist by artist and piece by piece because no single benchmark captures the asset class [3]. Value is also extraordinarily concentrated at the top: the top 100 artists account for roughly 64% of the value of the art market [10], so a holding built on one name carries the full idiosyncratic risk of that name.
Position sizing is the answer. Spread capital across several artist markets that you believe are appreciating for different reasons, so that a stumble in any one, a condition scandal, a gallery closing, a shift in collector taste, does not take the whole holding down with it. We treat art itself as a small sleeve of a broader portfolio, often under 5% to start, and then diversify within that sleeve. For a fuller treatment of why one-name exposure is so dangerous, see our piece on concentration risk in art.
5. The supply sweet spot: too little, too much, and the middle
Position sizing tells you how much of one name to own. Supply tells you which names can sustain a market at all. There is a happy medium, and both ends of the spectrum are traps.
Consider Arshile Gorky. He is genuinely significant, but there may be only around 20 good paintings left in private hands, with the rest in museums. There is not enough supply to sustain regular trading, so years can pass between comparable sales. The market is thin, price discovery is jumpy, and getting in or out at a fair price is hard. The quality is real. The liquidity is not.
Now consider the other end. Damien Hirst's spot paintings number well into the hundreds, produced over decades with studio assistants. Gagosian's 2012 exhibition alone showed several hundred across eleven galleries worldwide. When supply is that deep and that repetitive, buyers treat individual works as interchangeable and feel no urgency to pay up, because another similar work is always coming. After Hirst's 2008 peak, average prices for many works fell by more than 50%, unsold rates rose, and a large share of spot paintings bought near the top later resold at a loss [5]. Oversupply drowns demand.
The middle is where consistency lives. Think of an artist whose market trades often enough to give you continuous price discovery and a base of buyers, but not so often that scarcity disappears. That balance, steady appreciation over long periods rather than a spike that falls apart, is what a healthy artist market looks like. For more on how that scarcity supports value, see what blue-chip art actually means.
6. Holding period: why patience is built into the math
The frictions covered in section 3 do more than argue for buying below fair value. They argue for holding.
The academic record is consistent. Renneboog and Spaenjers, applying hedonic regression to more than a million auction transactions, find real art returns of about 3.97% a year between 1957 and 2007, bond-like real returns at equity-like risk [1]. Their selection-corrected work, which adjusts for the fact that owners tend to sell winners, puts nominal returns near 6.5% a year with volatility around 17% [4]. A broader six-decade study of nearly three million transactions finds nominal returns of about 6.24% a year, or 2.49% real, from 1958 to 2016 [9]. Against round-trip costs of 25% to 35%, an investor trying to flip a work over one to three years can watch the entire expected return disappear into fees.
Patience also gives the artist-market thesis time to play out. Recognition compounds slowly: a major museum acquisition, a retrospective, a new generation of collectors. None of that happens on a one-year schedule. Many works sit in families for years or decades, which is part of why the market turns over slowly in the first place. We typically treat art as a 3 to 10 year allocation, and we have argued elsewhere that patience is rewarded in art markets.
A word on the cycle, because patience is easy to recommend in a rising market and hard to keep in a falling one. The market has been down over the past several years. The Masterworks Post-War and Contemporary Index peaked near 23 in 2022 and sat around 15 to 16 by 2025 [11]. History suggests these corrections resolve: after the 2008 crisis the market recovered fully by 2011 and climbed for years more. We believe the repricing has likely run most of its course, though we do not have a crystal ball, and past performance is not predictive.
7. Think in Sharpe ratios, artist by artist
The last piece of the framework is the scorecard. Headline appreciation is the wrong one. Two artist markets that both returned 10% a year are not equally good investments if one did it smoothly and the other did it with violent swings.
We think in terms of risk-adjusted return, the way an equity investor thinks in Sharpe ratios: appreciation rate divided by volatility, artist market by artist market. The academic Sharpe ratios for art as a whole are humbling and worth stating plainly. Kraeussl's top-500-artist index shows a geometric return of about 7.3% a year over 24 years with a Sharpe ratio near 0.17, the most volatile asset in his sample [8]. The six-decade study puts art's Sharpe near 0.10 [9]. Selection-corrected, the broad market's Sharpe can fall to roughly 0.04 [4].
Those numbers are for the market as an undifferentiated whole, and that is the point. A disciplined holding is not the average artist market. It is a selected set of artist markets chosen for favorable return per unit of risk, sized to diversify away the idiosyncratic part, and entered below fair value to widen the margin. The framework is an attempt to do better than the index by being selective on every input the index averages over. Price behavior also differs sharply by price tier, which is its own input; see how $100k, $1M and $10M works behave differently.
This is also where the macro backdrop enters. The Art Basel and UBS report put 2025 global art sales at $59.6 billion, up 4%, with public auction up 9% to $20.7 billion, and the recovery concentrated at the very top end, works over $10 million, led by results like the Klimt portrait that hammered into the hundreds of millions [7][12]. Demand at the top is a call option on wealth creation among the ultra-wealthy. That is the structural tailwind a disciplined holding is positioned to capture.
The Bottom Line
- The order of decisions is the discipline: choose the artist market first, then buy the best available example at the lowest price.
- Quality within a market is close to a step function. A and B examples tend to track each other, while C examples often stay flat, so a discount on a weak work is not a margin of safety.
- Entry price is a controllable return driver. Buying below an independent fair value builds a cushion against transaction costs of roughly 25% to 35% and long-run returns that average in the mid-single digits.
- Concentration is the main risk inside art. Spreading capital across several artist markets converts a single-stock bet into a portfolio.
- Supply has a sweet spot. Too little starves liquidity, as with Gorky, and too much erodes price, as with Hirst's spot paintings.
- Time is part of the strategy. Frictions and slow recognition both reward a 3 to 10 year horizon over short holds.
- Risk-adjusted return, evaluated artist market by artist market, is the right scorecard. Past performance is not predictive.
Sources
- Renneboog, Luc and Christophe Spaenjers. "Buying Beauty: On Prices and Returns in the Art Market." Management Science, vol. 59, no. 1, 2013, pp. 36-53. https://dl.acm.org/doi/10.1287/mnsc.1120.1580
- Renneboog, Luc and Christophe Spaenjers. "Buying Beauty: On Prices and Returns in the Art Market." SSRN working paper (abstract 1352363), 2013. https://papers.ssrn.com/sol3/papers.cfm?abstract_id=1352363
- Morgan Stanley (The Greenfield Team). "Art as an Investment Class." Morgan Stanley, accessed June 2026. https://advisor.morganstanley.com/the-greenfield-team/articles/managing-significant-wealth/art-as-an-investment-class
- Renneboog, Luc and Christophe Spaenjers. "Does It Pay to Invest in Art? A Selection-Corrected Returns Perspective." Working paper, EconStor. https://www.econstor.eu/bitstream/10419/87687/1/771627165.pdf
- Mercer Advisors. "Investing in Fine Art: A Guide on Risks, Returns, and How to Integrate Your Collection Into Your Wealth Plan." May 21, 2026. https://www.merceradvisors.com/guide/investing-in-fine-art-a-guide-on-risks-returns-and-how-to-integrate-your-collection-into-your-wealth-plan/
- Citrin Cooperman. "Investing in Art: A Growing Asset Class." August 4, 2025. https://www.citrincooperman.com/In-Focus-Resource-Center/Investing-in-Art-A-Growing-Asset-Class
- Art Basel and UBS. "The Art Basel and UBS Global Art Market Report 2026" (covering 2025 data), by Dr. Clare McAndrew, Arts Economics. April 2026. https://www.artbasel.com/stories/the-art-basel-and-ubs-global-art-market-report-2026
- Kraeussl, Roman and Robin van Elsland. "Art as an Investment: The Top 500 Artists." European Financial Management Association symposium paper, Toronto 2011. https://www.efmaefm.org/0efmsymposium/2011-toronto/papers/kraeussl.pdf
- Financial Forum / Bank- en Financiewezen. "Investing in Art: Returns, Risks, and Market Dynamics Over Six Decades." May 22, 2025. https://financialforum.be/en/bfw-digitaal/investing-in-art-returns-risks-and-market-dynamics-over-six-decades
- Lynn, Scott (Masterworks). Stated segment appreciation estimates and market concentration figures, Masterworks investor commentary, 2026.
- Masterworks Research. "Masterworks Post-War and Contemporary Art Index" (PWC Index), referenced figures, 2026.
- Art Basel. "What a Decade of Research Reveals About the Global Art Market." April 8, 2026. https://www.artbasel.com/stories/what-a-decade-of-research-reveals-about-the-global-art-market
Disclosures
Investing involves risk. Past results are not indicative of future outcomes.
Masterworks is providing this communication as an agent for its issuer entities, not Masterworks Advisers. This material is produced by Masterworks for informational purposes only and does not constitute investment advice, a recommendation, or an offer or solicitation to buy or sell any security. Masterworks is not a licensed broker-dealer by the SEC or FINRA.
Masterworks can only make and accept sales after an offering statement has been filed, and "qualified", by the SEC. Any offers may be revoked before notice of qualification. Indications of interest involve no obligation. For further disclosure visit the offering documents filed with the SEC and Important Disclosures at masterworks.com/cd.
Forward-looking statements and internal estimates are based on assumptions that may prove incorrect, and actual outcomes may differ materially. Figures denoted in brackets are subject to confirmation. Investing in art and alternative assets involves risk, including loss of principal.
Art sales price data is comparative only. Each painting is unique and historical data is not a direct proxy for any specific painting or investment. Data represents whole art, not an investment into our offerings which includes fees and expenses. Any comparative images are not currently live offerings and are provided for educational purposes only.
Masterworks, LLC is located at 1 World Trade Center, 57th Floor, New York, NY 10007.