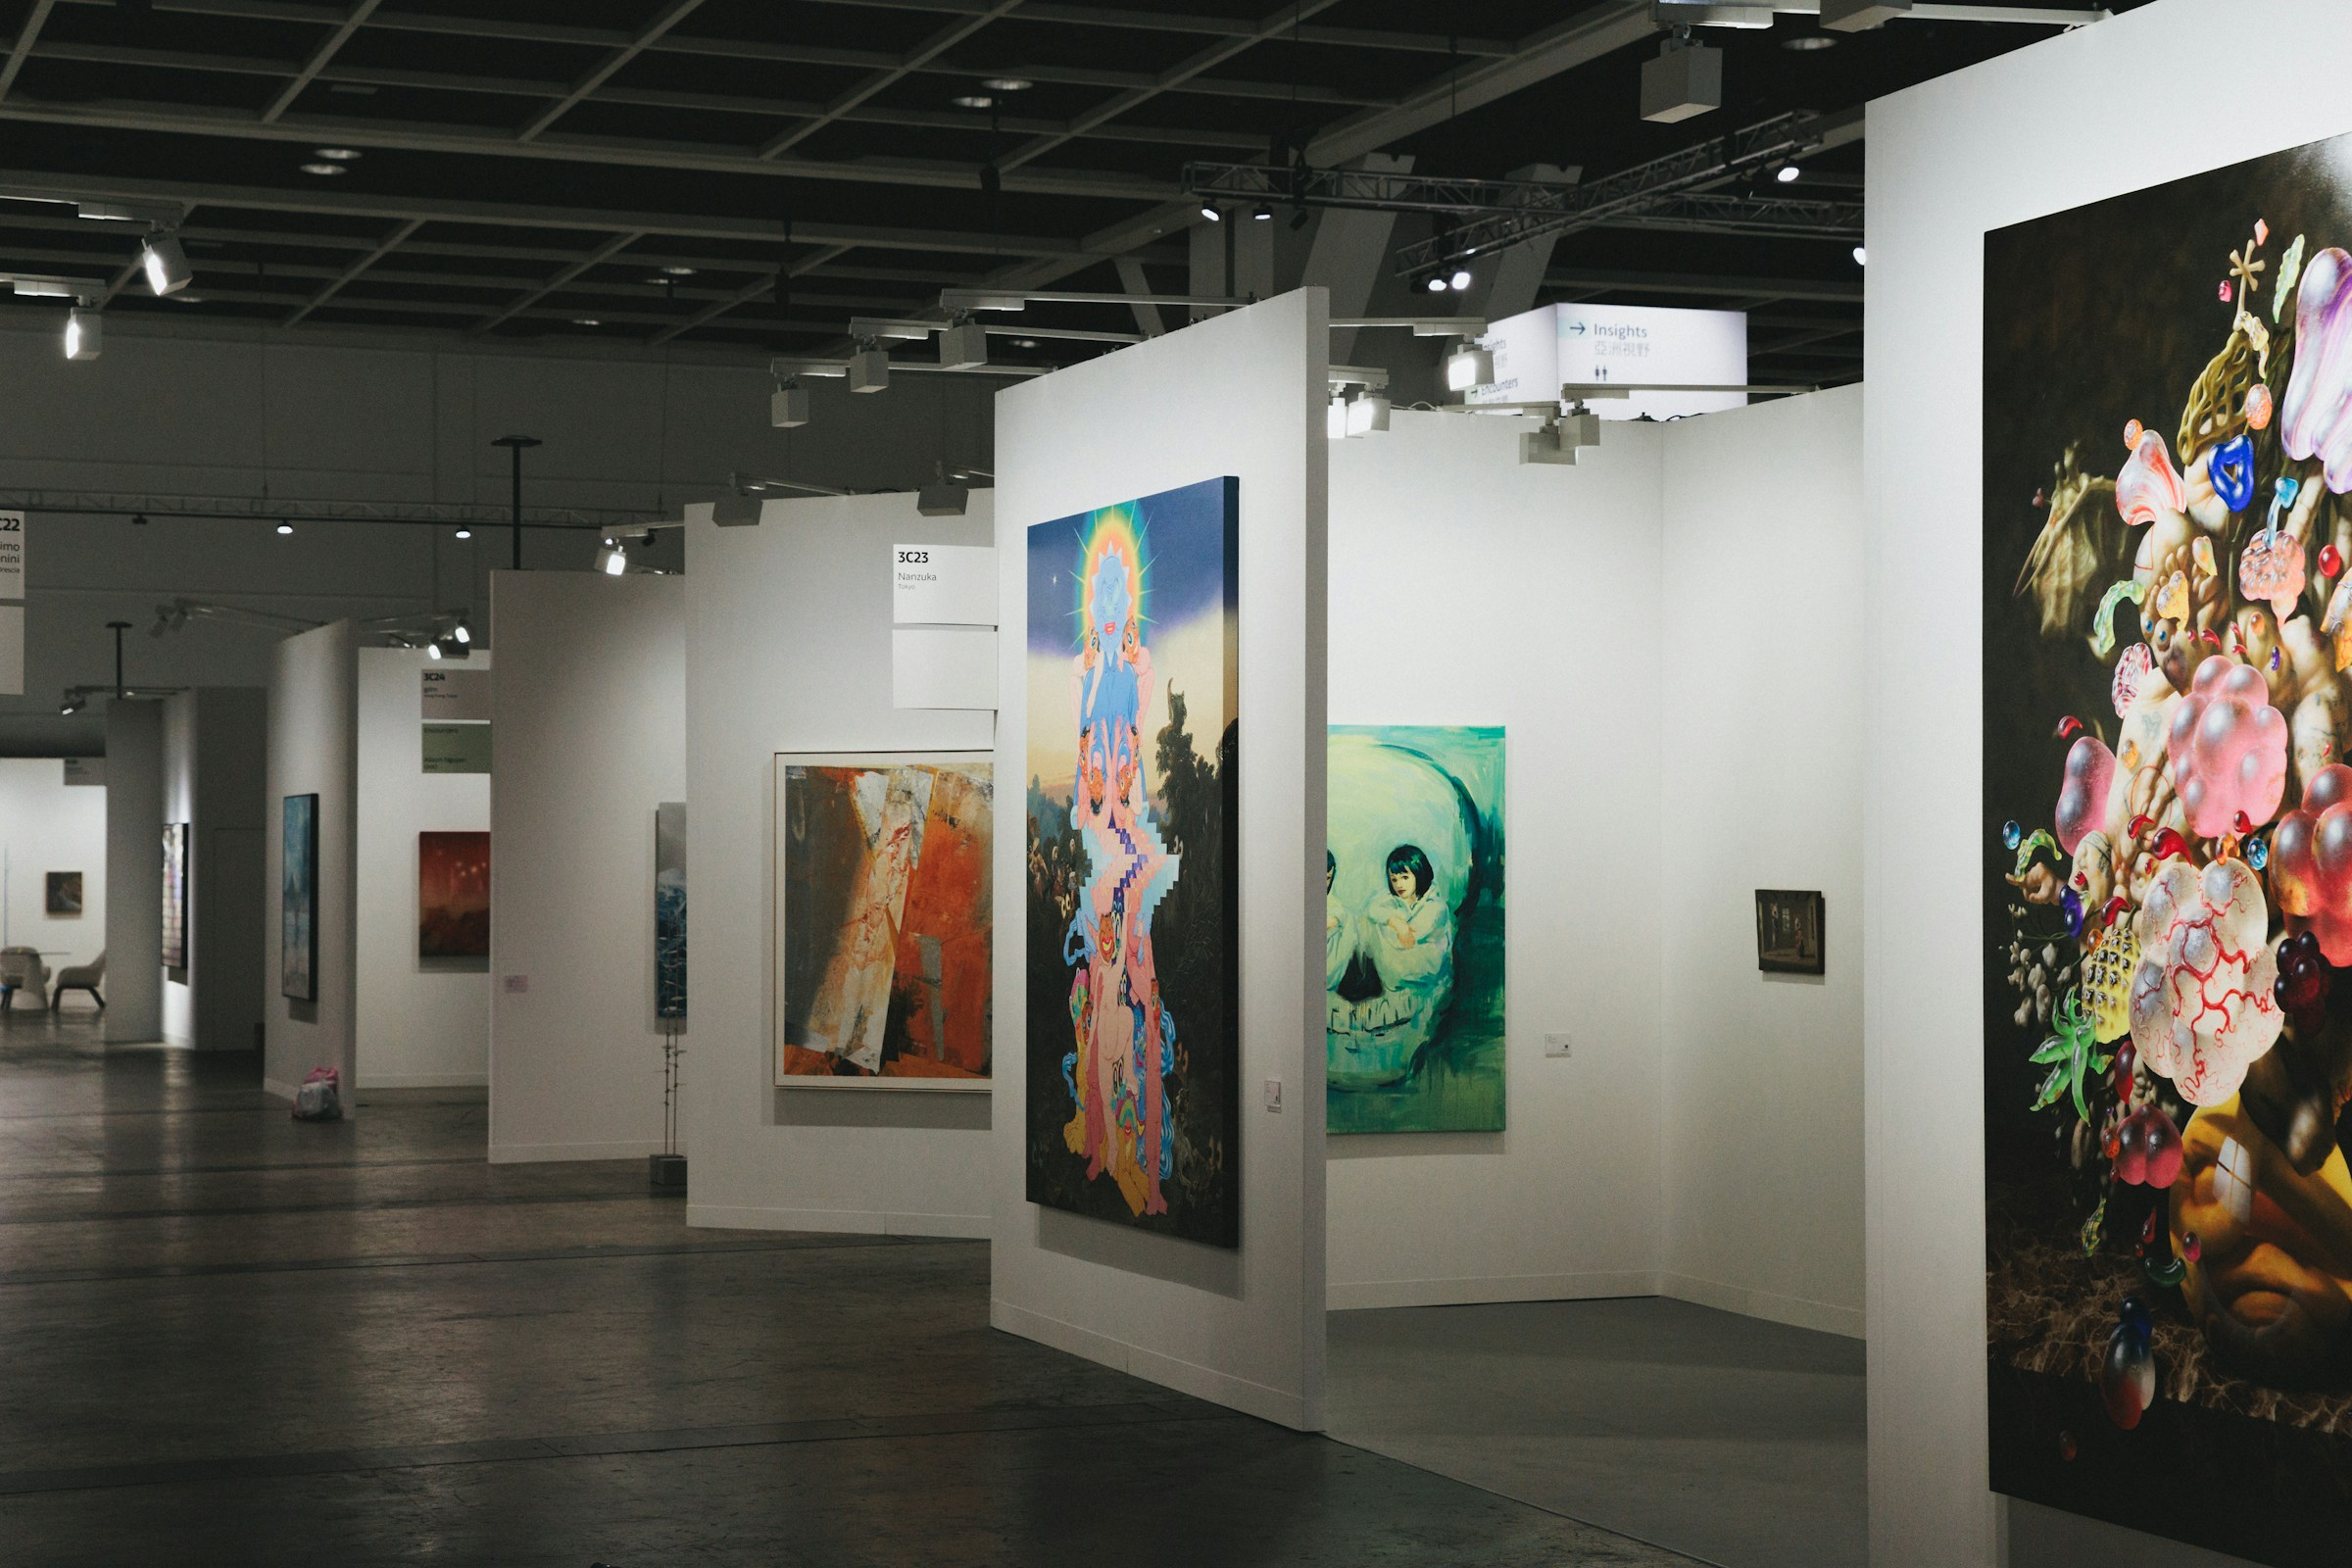
The art market is the global network of dealers, galleries, auction houses, advisors, and fairs through which art changes hands. In 2025 it moved an estimated $59.6 billion across roughly 41.5 million transactions, split about 58% through dealers and galleries and 35% through public auctions, with the balance in private sales. Three traits set it apart from any market an investor already knows: it is smaller than most people assume, more concentrated at the top than almost any other asset market, and far less transparent than a stock exchange. Nearly everything about how art behaves as an asset follows from those three facts.
We spend most of our time inside this market. We buy paintings, hold them, and sell them, and we have built the data infrastructure to price them. This is the map we wish we had been handed on day one: how the money flows, who the players are, how a price gets set, and where the inefficiency that draws investors actually sits. The critic Robert Hughes put the whole thing in one line, quoted in Don Thompson's study of the market: a fair price is "the highest one a collector can be induced to pay."
How big is the global art market?
Global art sales reached an estimated $59.6 billion in 2025, up 4% on the year, according to the Art Basel and UBS Global Art Market Report compiled by the economist Dr. Clare McAndrew. That total sounds large until you set it against a public market. The entire world's trade in fine art and antiques, every Picasso and every print, is smaller than the market capitalization of a single mid-cap company. Apple trades more than $59.6 billion of stock in a matter of days.
That scale is the first thing to hold onto, because it explains the market's volatility. A handful of billionaires deciding to buy or sit out can swing the top of the market in a season.
The total divides into two halves that behave differently. Dealers and galleries did about $34.8 billion, or roughly 58% of the market, spanning both new work sold for the first time and resales. Public auctions did $20.7 billion, about 35%, up 9% on the year. Private sales brokered by the auction houses added a further $4.2 billion, around 7%. Online sales, embedded across both channels, ran near $10.5 billion, about 18% of the total, roughly double their pre-pandemic share.
Transaction volume runs the other way. Those 41.5 million sales are overwhelmingly small: works under $50,000 now account for about 87% of all dealer transactions. The market is a wide base of modest sales with a very thin, very tall spike of expensive ones on top, and the spike is where investors should focus.
Who are the participants in the art market?
Art passes through more hands per transaction than most assets, and typically each participant takes a cut or shapes a price.
Artists and the primary market. Every work starts with an artist, whose new pieces are usually placed by a gallery that represents them. The gallery typically works on consignment and keeps 40% to 50% of the sale price. This is the primary market, the first sale of a work.
Dealers and galleries. Beyond primary representation, secondary dealers trade works that already have an owner, competing directly with the auction houses for the same consignments. At the top sit the mega-galleries, Gagosian, Hauser & Wirth, and David Zwirner among them, which run spaces across New York, London, Paris, and Hong Kong and combine primary representation with large secondary businesses. The dealer sector is polarizing: in recent years the smallest galleries, under $250,000 in turnover, grew fastest, while the largest, above $10 million, saw sales slip. Power and visibility concentrate at the top even as growth does not.
Auction houses. Christie's, Sotheby's, and Phillips run the public secondary market as some of the largest auction houses. In 2025 Sotheby's did about $7 billion in total sales, up 17% by volume, and Christie's $6.2 billion, up 6%, with both houses posting a roughly 26% surge in the second half of the year. Phillips is the smaller third. They are where price discovery happens in public, which makes them the closest thing the market has to a ticker.
Art fairs. Fairs such as Art Basel, Frieze, and TEFAF are temporary, concentrated selling events where galleries rent booths. They now account for 31% to 35% of all dealer sales, a meaningful share of the primary and secondary trade compressed into a few intense weeks a year.
Advisors, collectors, and institutions. Art advisors guide wealthy buyers through a market with no posted prices. Collectors, from local buyers to billionaires, supply the demand. Museums rarely move much volume, but they set value in a way no other participant can. Thompson estimates that a solo retrospective at a branded museum can lift an artist's prices 50% to 100%, which turns curators into unintentional market-makers and gives collectors who sit on museum boards an information edge that would look like insider trading in any regulated market.
Freeports. A large share of the most valuable art never hangs on a wall. It sits in freeports, high-security customs-free warehouses in Geneva, Luxembourg, and Singapore, where works are stored in bond and taxes are deferred until the piece formally enters a country. The Geneva freeport alone is thought to hold well over $100 billion of art, some of it bought and sold inside the building without ever moving. As the journalist Georgina Adam comments, art "was once rated by its attractiveness" and "is now assessed by its attractiveness to tax."
What is the difference between the primary and secondary art market?
The distinction matters more to an investor than to a collector. The primary market is the first sale of a work, from artist to first owner, almost always through a gallery. Prices there are set by the gallery, not by open bidding, and access is rationed. A sought-after living artist's new work goes not to the highest bidder but to whoever the gallery deems worthy, often a buyer judged more likely to donate the work to a museum rather than flip it. One collector described the process to Artnet as being told to "send a long email to a gallery describing why you are worthy of an artwork."
The secondary market is every sale after the first, through auction houses and secondary dealers. This is where works trade on something closer to open demand, and dealers police the boundary between the two aggressively. Collectors who buy on the primary market and quickly resell at auction are often blacklisted. For an investor, the practical takeaway is that the primary market is largely closed, and the secondary market is where an asset can be priced and eventually sold. The blue-chip works that behave most like an investable asset, by artists whose reputations are settled, trade almost entirely there.
How does an art auction actually work?
An auction runs on four main numbers, and the gap between them is where the money is made and lost.
The estimate is the house's published opinion of value, a low and a high figure, set before the sale. However, this is just a general framing, and academic work by Bruno and Nocera finds that presale estimates "are not good predictors of final sale prices." The reserve is the seller's confidential minimum, the price below which the work will not sell, usually set around 70% to 80% of the low estimate and never above it. The hammer price is the winning bid when the auctioneer's gavel falls. And the buyer's premium is the surcharge the winning bidder pays on top of the hammer, which goes to the house.
That premium is larger than newcomers expect, and it has climbed relentlessly. When Christie's and Sotheby's introduced the buyer's premium in 1975 it was a flat 10%. Today, at Christie's in the United States, the buyer pays 28% on the first $2 million of the hammer price, 22% on the portion up to $8 million, and 15% above that, a schedule in effect since September 1, 2026. On a work that hammers at $2 million, the premium works out to $560,000, taking the buyer's total to roughly $2.56 million before taxes and shipping. For example, the highest art price achieved at auction for Leonardo Da Vinci’s “Salvator Mundi” hammered at $400 million with a premium of an additional $50 million. The bidding driving the prices up to those heights happens in the room, usually by phone through house staff, by absentee bid left in advance, and online. At the very top, some houses build private "sky boxes" with one-way glass so the ultra-wealthy can bid unseen.
When the top bid fails to reach the reserve, the lot is "bought in," the market term for an unsold work. To nudge bidding up toward that confidential reserve, an auctioneer will call out "chandelier bids," bids that do not exist, taken figuratively off the chandelier. If no real bidder crosses the reserve, the lot goes unsold and, in the trade's own word, is "burned," carrying a stigma that can make it unsalable for years. The buy-in rate, the share of lots that fail this way, is one of the most honest signals of demand in a given sale, which is exactly why the mechanics around it are managed so carefully.
How do auction houses make money, and what are auction guarantees?
The buyer's premium is the largest line on the revenue side, but far from the only one. Houses also charge the seller a commission, though on trophy consignments they routinely waive it and go further, offering an "enhanced hammer" that hands the seller a share of the buyer's premium too. When the collector Peter Brant consigned Jeff Koons's "Balloon Dog (Orange)," Christie's reportedly waived his seller's fee and gave him a large slice of the premium, forgoing its own profit for the prestige of the sale. Houses also broker private sales off the auction floor, a channel that has grown quickly, and they also lend against art as collateral.
The mechanism that now shapes the high end most is the guarantee. A guarantee is a promise to the seller of a minimum price whatever happens in the room. In a house guarantee, the auction house itself makes that promise and takes the risk onto its own balance sheet. In a third-party guarantee, also called an irrevocable bid, an outside financier agrees in advance to buy the work at a set price if no one bids higher. The house has offloaded its risk, the seller is protected, and the guarantor is paid for taking the other side, commonly around a quarter of any upside above the guarantee.
Guarantees are no longer a niche tool. Financial guarantees have backed close to two-thirds of evening-sale value since 2021, and by the first half of 2025 third parties, not the houses, were supplying 96% of that guaranteed value, according to the Deloitte Art & Finance Report. That business has gotten harder: Deloitte estimates the average return to guarantors fell from 21.4% in 2021 to about 5.7% across 2023 to mid-2025. For an investor reading auction results, the takeaway is that a headline price often had a pre-arranged minimum. Edward Dolman, the chief executive of Phillips, put it plainly: a guaranteed result "gives you a sense of what one individual has been prepared to pay," not the temperature of the market. Guarantees also help published sell-through rates, because a guaranteed lot almost never goes unsold.
How are art prices set?
There is no formula, but there is a method. Dealers, appraisers, and auction specialists price a work similar to the way a real estate appraiser prices a house: by leaning on comparable sales. They find recent results for closely matched works, same artist, similar size, medium, subject, period, and condition, and adjust up or down from there. Economists formalize the same logic as hedonic regression, breaking a price into the implied value of each attribute, and build repeat-sales indices that track the same work across two sales to measure how prices move over time.
The attributes that move a price are measurable, and the effects are large. A 2022 study in Management Science quantified how much documentation is worth at auction: a recorded exhibition history raised hammer prices by roughly 42%, and a reference in the scholarly literature by as much as 54%. This is why provenance, the documented chain of ownership and exhibition, is one of the strongest price drivers in the market. It is the market paying to reduce doubt about authenticity and importance.
Authenticity is the most violent variable of all. Claudia Andrieu, legal counsel to the Picasso Administration, calls authentication "an act of power," because on an authenticator's say-so "a work of art can be worth millions, or virtually nothing." When Rembrandt's "Man with the Golden Helmet" was reattributed to a pupil, its value fell to roughly a tenth of its former estimate. Condition works the same way in smaller steps. Julian Thompson, a former chairman of Sotheby's Asia, once put precise numbers on it for Imperial Chinese porcelain: a piece is worth perhaps 90% less if broken, 70% less if cracked, and 50% less if chipped. Size, medium, and rarity round out the model. Oils command large premiums over works on paper, bigger canvases generally fetch more than small ones by the same hand, and because most canonical artists are dead, the supply of their best work is fixed, so a rare example can jump in price on scarcity alone.
Why is the art market so opaque?
Because it has no tape. In a stock market, every trade prints to a public feed within seconds, and spreads on liquid shares run well under 1%. The art market has no equivalent. Roughly two-thirds of its value, on the order of $38 billion of the 2024 total, changes hands through dealer and private channels that never publish a price. Even for actively traded living artists, the Deloitte Art & Finance Report cites analysis finding that 84% of sales happen privately, through channels that are "neither standardized nor broadly accessible." Most galleries do not post prices at all, which lets them quote different numbers to different buyers and anchor to a buyer's perceived wealth rather than to any public reference.
That opacity has a darker use. Because buyers and sellers can hide behind advisors and shell companies, and because a painting is portable and holds value, art has long served as a vehicle for moving money quietly. A former federal prosecutor, Sharon Cohen Levin, told the author Michael Shnayerson that when a work "goes through a private dealer, art is the easiest money-laundering vehicle there is."
That quote has aged, however. Since 2020, the EU and UK have required art market participants to run anti-money-laundering checks on any transaction of 10,000 euros or more: verify the customer, name the beneficial owner behind any buying entity, and report anything suspicious. The United States has never finalized an art-specific rule, but the money now polices itself, since every serious payment clears through a bank with its own full anti-money-laundering duties, and the major auction houses screen buyers and sellers to the European standard voluntarily. Treasury's 2022 study found limited evidence that high-value art is widely used for laundering, and the circulating estimates of $1.6 to $3 billion a year, shaky by their own authors' admission, are a rounding error against the market. What remains is easy to avoid both in practice and market analysis, because it announces itself pretty plainly: a buying entity that will not name its owner, a gap in the provenance, a price far off the comps, a work that trades freeport to freeport without ever surfacing.
Our index and research rest on public auction records, the identified and published slice of the trade. Masterworks offerings add a securities layer on top: being qualified by the SEC, with a public offering statement and ongoing filings, so the ownership of the works we hold is a matter of public record. Qualification is permission to offer, no more, and it is no comment on merits. But it does put the paper trail in the open, which is the reverse of how this market has usually run.
For an investor this cuts two ways. Opacity is a real risk, because carefree buyers can overpay or buy poorly. It is also the source of the opportunity. An efficient market prices out easy gains; an opaque one does not. The edge in art belongs to whoever closes the information gap, and closing it is a data problem before it is anything else.
Why does value concentrate at the very top of the art market?
The art market is one of the most top-heavy markets that exists. In 2024, works priced above $1 million made up just 4.2% of all lots sold but generated 70.7% of total market value, according to Deloitte. Widen the lens and the pattern holds: between 2015 and mid-2025 the top 100 artists accounted for 76.4% of all auction value, and that group is 0.85% of the artists who came to auction. So, a few dozen names carry the market.
This concentration is why the top behaves like a call option on the wealth of the global top 1%. The buyer for a $30 million painting is one of a few thousand people on earth, and not long ago it was far fewer. Thomas Seydoux, formerly of Christie's, has said that twenty years ago "there were under 100 buyers in the world for major works of art, those that fetched over $5 million." When billionaire wealth expands, that demand strengthens; when it contracts, the high end cools first and hardest. That pool of wealth is growing now for a particular reason. The fortunes being minted in artificial intelligence, in founder stakes and early-employee equity, are creating ultra-wealthy buyers at a pace not seen since the dot-com era, and because the supply of blue-chip work is fixed, more buyers competing for the same paintings is the demand engine. The motive is rarely financial. As Amy Cappellazzo, then a Christie's specialist, put it: "After you have a fourth home and a G5 jet, what else is there? Art is extremely enriching." The very wealthy allocate accordingly. The 2025 Art Basel and UBS survey of collectors found that high-net-worth individuals held an average of 20% of their wealth in art, and those worth more than $50 million held 28%.
The broader market below $50,000, which is 87% of all transactions by count, runs on different fuel. It is driven by local collectors and lifestyle spending, is less tied to billionaire wealth, and moves more slowly in both directions. Both markets are real. Only one of them behaves like an investable asset, and it is the narrow, expensive, wealth-linked top.
Does the art market move in cycles?
It does, and the last five years are a clean illustration. Global sales ran $67.8 billion in 2022, fell to $65 billion in 2023, then to $57.5 billion in 2024, down 12%, before recovering 4% to $59.6 billion in 2025. The two-year decline was concentrated almost entirely at the high end, while the sub-$5,000 segment kept growing. Just as the market is concentrated at the top, the downturn was mostly fixated on the trophies, where many noted that quality was not coming to market.
The recovery has been sharp. In the first half of 2026, auction sales at Christie's, Sotheby's, and Phillips jumped about 70% year on year to $6.8 billion, according to ArtTactic data reported by The Art Newspaper. Christie's posted its strongest half in five years, and Sotheby's set a first-half record of $4.4 billion. The trophies led the way back: Jackson Pollock's "Number 7A, 1948" sold for $181.2 million, and a single collection in London made $406.2 million, the largest sale of its kind ever staged in Europe. Chinese buyers, largely absent for more than two years, returned in force; at Sotheby's Hong Kong, Joan Mitchell's "La Grande Vallée VII" sold for about $17.5 million, a record for a woman artist at auction in Asia. ArtTactic's Anders Petterson notes that confidence has spread down from the very top into the "middle core," with the $50,000 to $500,000 band showing the strongest growth. It remains a buyer's market, with negotiated discounts of 10% to 20% common and a clear flight to quality toward proven names like Warhol, Monet, and Picasso.
This cyclicality is real and we do not wave it away, but the pattern is consistent enough to plan around. The academic record confirms the swings: Renneboog and Spaenjers estimated that art appreciated about 4% a year in real terms from 1957 to 2007, with the 2002 to 2007 boom running near 12% a year. Our own history of the Post-War and Contemporary market shows the recoveries too. After the 2008 crisis, prices in that category fell roughly 35%, the same order as the recent correction, and had recovered fully by 2011 before climbing for six more years, while the milder 2016 downturn was recovered within about eighteen months. In both cases the investors who fared best were the ones who bought near the bottom, which is the discipline the asset rewards and the patience it demands.
Is art actually a good investment?
The honest answer holds two ideas at once, and we would rather concede the hard one than sell past it.
The skeptical case is thorough and comes from serious people. William Baumol, studying three centuries of resales, found real returns on paintings averaging about 0.55% a year, below government bonds, and called art investment a "floating crap game." More recent work is not much kinder to the broad market: the Artnet Fine Art top-100 index returned about 3.2% a year over the past two decades against 10.4% for the S&P 500. And the headline indices flatter reality, because they quietly drop the works nobody wants to resell. When Korteweg, Kräussl, and Verwijmeren corrected for that selection bias, average annual returns fell from 8.7% to 6.3%, and the risk-adjusted return, the Sharpe ratio, dropped to 0.111 against 0.358 for U.S. equities. Add transaction costs that can reach 20% to 25% on a single round trip, and the dealer Stefan Simchowitz's verdict starts to look fair: "Art as an investment? Terrible! Awful. No liquidity, difficult to sell." Don Thompson notes that only about one in five contemporary works ever makes it back to a major auction at all.
The case for the asset is narrower, and it turns on segment and selection. Broad indices disappoint partly because they average in the works nobody wants to resell. The blue-chip segment behaves differently. Our own value-weighted repeat-sales index of the Post-War and Contemporary category shows that segment appreciating about 10.2% a year from 1995 through the first quarter of 2026, close to the S&P 500's 10.1% over the same period, while moving independently of it, with a correlation of -0.11 to the S&P and -0.01 to gold. A correlation that low means art moves largely on its own supply and demand rather than on whatever is driving equities. The first quarter of 2026 showed that starkly, when the S&P 500 fell 4.6% and Bitcoin dropped 22% while our index posted its strongest quarterly gain since the market peaked in 2021. Two caveats: past performance is not indicative of future results, and an index of the top of the market is not the average painting. But the distance between the average work and the blue chip is where selection earns its keep, and data and discipline can close it. Philip Hoffman, who runs the Fine Art Group, makes the same case from the inside: "we made money on 84% of the art we bought, we lost it on 16%." The market's opacity, which makes it dangerous for a casual buyer, is exactly what creates room for an informed one.
This is the gap our own model is built around. Masterworks buys blue-chip paintings, mostly Post-War & Contemporary, and makes them available to investors as shares through securitization with the SEC. According to Masterworks data, it has made more than $1.2 billion in art acquisitions since 2019, more than 525 works, and more than 70,000 people have invested with it. Investing with Masterworks starts with Masterworks Club membership, a membership organized around private events at galleries, museums and auction houses in New York. Pricing hundreds of paintings means solving the market's information problem first, which is why our research team built its own database of auction records and has analyzed the sales of 24,000 artists. In a market with no tape, the record you build yourself is the edge.
Sources
- Art Basel and UBS. "The Art Basel and UBS Global Art Market Report 2026." UBS / Arts Economics (Dr. Clare McAndrew), March 2026. https://www.ubs.com/global/en/our-firm/art/art-market-research.html
- The Art Newspaper. "Art Basel and UBS art market report: 4% growth in 2025." March 12, 2026. https://www.theartnewspaper.com/2026/03/12/art-basel-ubs-art-market-report-2025-four-percent-growth
- Art Basel and UBS. "Survey of Global Collecting 2025." Arts Economics (Dr. Clare McAndrew), 2025. https://www.artbasel.com/stories/the-art-basel-and-ubs-global-art-market-report-2026
- Deloitte Private and ArtTactic. "Art & Finance Report 2025." Deloitte Luxembourg, 2025. https://www.deloitte.com/lu/en/services/financial-advisory/research/art-finance-report.html
- Kazakina, Katya, and Margaret Carrigan. "Artnet Intelligence Report, Spring 2025." Artnet, March 2025. https://www.artnet.com/
- Brady, Anna. "Auction houses made significant recoveries in 2026, ArtTactic report finds." The Art Newspaper, 2026. https://www.theartnewspaper.com/
- Brady, Anna. "Christie's and Sotheby's 2026 half-year results: trophy lots and luxury goods fuel recovery." The Art Newspaper, 2026. https://www.theartnewspaper.com/
- Carrigan, Margaret. "Sotheby's Posts $4.4 Billion in First-Half Sales, a New Record." Artnet News, 2026. https://news.artnet.com/
- Christie's. "Christie's 2024 results down 6 percent from 2023." The Art Newspaper, December 17, 2024. https://www.theartnewspaper.com/2024/12/17/christies-2024-results-down-6-percent-from-2023
- Adam, Georgina. "Big Bucks: The Explosion of the Art Market in the 21st Century." Lund Humphries, 2014.
- Adam, Georgina. "Dark Side of the Boom: The Excesses of the Art Market in the 21st Century." Lund Humphries, 2017.
- Thompson, Don. "The $12 Million Stuffed Shark: The Curious Economics of Contemporary Art." Palgrave Macmillan, 2008.
- Velthuis, Olav. "Talking Prices: Symbolic Meanings of Prices on the Market for Contemporary Art." Princeton University Press, 2005.
- Thornton, Sarah. "Seven Days in the Art World." W. W. Norton, 2008.
- Shnayerson, Michael. "Boom: Mad Money, Mega Dealers, and the Rise of Contemporary Art." PublicAffairs, 2019.
- Horowitz, Noah. "Art of the Deal: Contemporary Art in a Global Financial Market." Princeton University Press, 2011.
- Hook, Philip. "Breakfast at Sotheby's: An A-Z of the Art World." Penguin, 2013.
- Robertson, Iain, and Derrick Chong. "The Art Business." Routledge, 2008.
- Baumol, William J. "Unnatural Value: Or Art Investment as Floating Crap Game." American Economic Review, Vol. 76, No. 2, May 1986. https://www.jstor.org/stable/1818729
- Renneboog, Luc, and Christophe Spaenjers. "Buying Beauty: On Prices and Returns in the Art Market." Management Science, Vol. 59, No. 1, 2013. https://pubsonline.informs.org/doi/10.1287/mnsc.1120.1580
- Korteweg, Arthur, Roman Kraussl, and Patrick Verwijmeren. "Does It Pay to Invest in Art? A Selection-Corrected Returns Perspective." Review of Financial Studies, Vol. 29, No. 4, 2016. https://academic.oup.com/rfs/article/29/4/1007/1591542
- Pénasse, Julien, Luc Renneboog, et al. "In Art We Trust." Management Science, 2022. https://pubsonline.informs.org/doi/10.1287/mnsc.2022.4633
- Yale Insights. "Shining a Light into the Black Box of the Art Market." Yale School of Management. https://insights.som.yale.edu/
- Masterworks. "Post-War & Contemporary Art Index." Internal Masterworks analysis, a value-weighted repeat-sales index of historical art market prices, 1995 to Q1 2026. Appreciation and correlation figures. Past performance is not indicative of future returns; US housing data through 12/31/2025.
- Lynn, Scott. "Q1 Masterworks Shareholder Letter: The Art Market is Back." Masterworks, April 20, 2026.
Disclosures
Investing involves risk. Past results are not indicative of future outcomes. All visuals are for illustrative purposes only.
This communication is provided by Masterworks, LLC ("Masterworks"), not by Masterworks Advisers, LLC ("Masterworks Advisers"). It does not contain legal, tax, or investment advice or a personalized recommendation, and Masterworks is not a licensed broker-dealer. Masterworks and Masterworks Advisers operate as separate legal entities and provide materially different services. Masterworks Advisers is a wholly owned subsidiary of Masterworks, and Masterworks receives fees and compensation from the Masterworks securities that Masterworks Advisers recommends to advisory clients. For further disclosure, review the offering documents and the Important Disclosures at masterworks.com/cd.
Art sales price data is comparative only. Each painting is unique and historical data is not a direct proxy for any specific painting or investment. Data represents whole art, not an investment into Masterworks securities, which includes fees and expenses. Any comparative images are not currently live offerings and are provided for educational purposes only. Art can be highly illiquid, there is no set time period within which Masterworks is obligated to sell a work, and investors must be prepared to hold for an extended period.
Comparisons to other asset classes carry significant limitations, particularly over shorter periods, and should not be relied on unduly. Exchange-traded stocks, commodities, and precious metals are priced continuously, whereas art prices are updated only when public auctions are held. As a result, other asset categories may appear more volatile than art and will react more quickly to events and market forces.
Investing in art involves considerable risk, including: investments and art are highly illiquid; artwork may be sold at a loss; costs will diminish returns; art is subject to damage, fraud, and litigation; trends in the art market may be temporary; insurance coverage may be insufficient; Masterworks has significant conflicts of interest; and liquidation timing is uncertain.
Post-War & Contemporary index: appreciation and correlation figures are based on internal Masterworks analysis of a repeat-sales index of historical art market prices, computed on a value-weighted basis and focused on the Post-War & Contemporary Art category, using the S&P CoreLogic Case-Shiller Home Price Indices methodology. Auction results realized in currencies other than U.S. dollars are converted using FRED (St. Louis Federal Reserve) exchange rates at the time of the most recent sale. The quarterly index is calculated internally on a rolling basis using repeat-sale pairs from the previous five quarters. "S&P 500" refers to the S&P 500 Total Return. All data is calculated from 12/31/1995 to 3/31/2026; index data from 1/1/2026 to 3/31/2026 is preliminary and may be subject to revision. Selection of different index inputs or time periods would result in different returns.
Individuals and institutions referenced are not investors in Masterworks offerings and were not compensated for their commentary. Their affiliation with art or specific artists is not an endorsement of Masterworks. Names and brands are used for identification purposes only.
