Masterworks Research · June 2026
Why lump-sum investing wins on the math about two-thirds of the time, why dollar-cost averaging still earns its place as a discipline against regret, and what both mean for building exposure to an asset you cannot trade by the minute.
If you have a sum to invest and you are deciding whether to put it all in at once or spread it out, the historical data points one way. Lump-sum investing has beaten dollar-cost averaging roughly two-thirds of the time across the major equity markets Vanguard studied, because markets rise more often than they fall and money left on the sidelines gives up the return it could have been earning [1][2]. Dollar-cost averaging, the practice of investing a fixed amount at regular intervals, trades a slice of that expected return for a smoother ride and less chance of bad timing. For an investor weighing the two, the question is rarely which is mathematically optimal. It is which one you can actually stick with, and how each behaves in a market you cannot watch tick by tick.
What You Need to Know
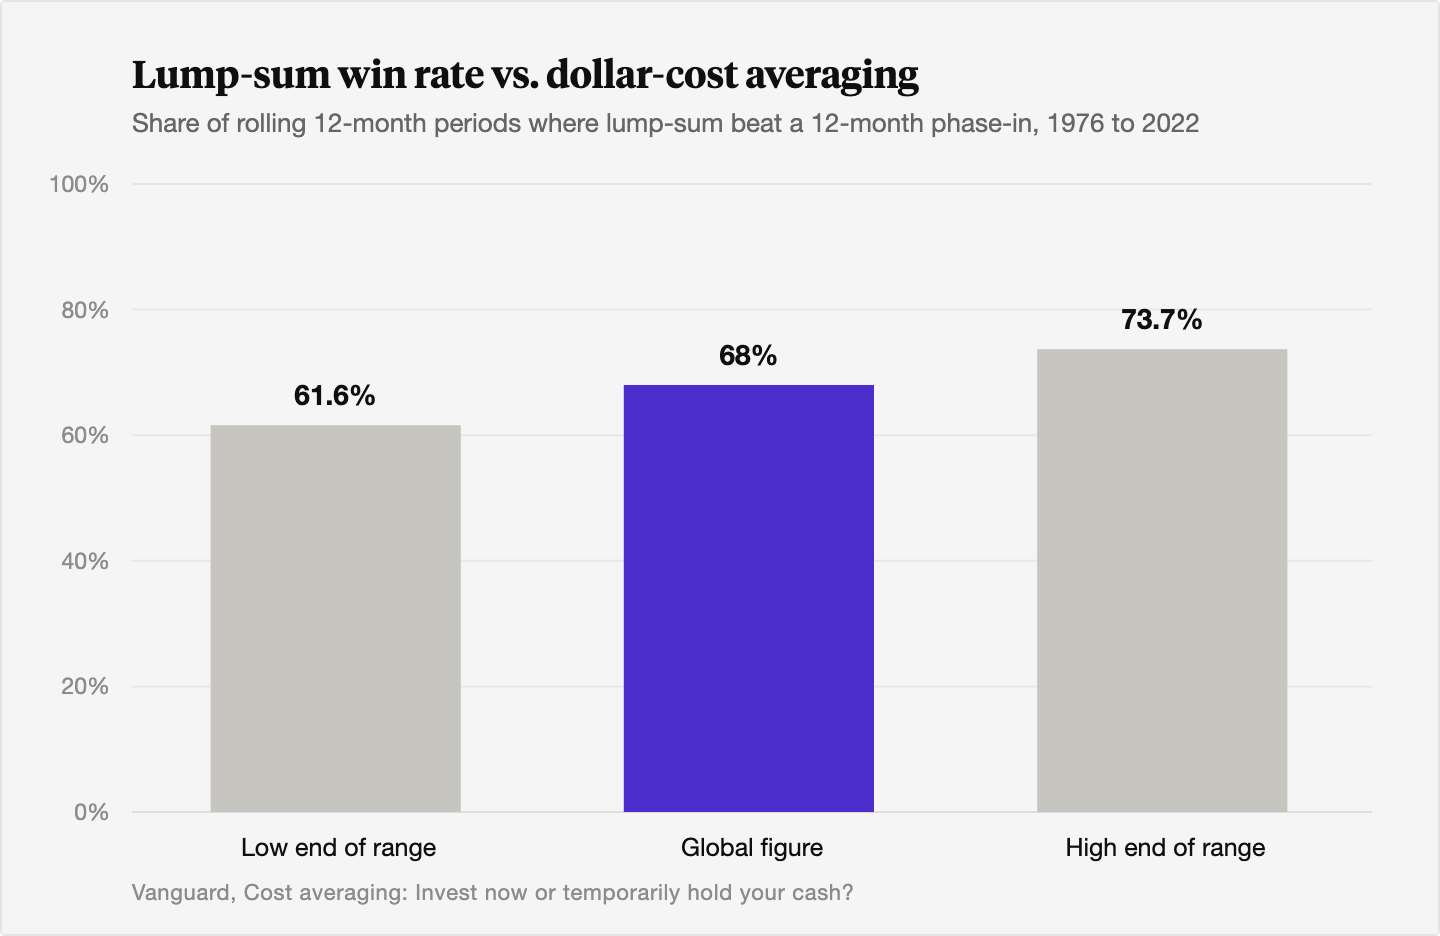
- Lump-sum wins about two-thirds of the time. Vanguard found lump-sum investing outperformed a 12-month dollar-cost averaging schedule in roughly 68% of historical periods across the U.S., U.K., and Australia, with the win rate ranging from about 62% to 74% by region [1][2].
- The reason is simple arithmetic. Stocks have finished positive in about 70% of calendar years, so delaying entry usually means less time exposed to a positive expected return. Money waiting to be invested earns cash returns, not equity returns [3][8].
- The edge is real but modest. Vanguard measured an average advantage of roughly 1.2 to 2.4 percentage points for lump-sum over a 12-month phase-in, depending on the stock and bond mix [1][2]. Morgan Stanley found lump-sum won about two-thirds of the time over seven-year horizons, by roughly 0.42% annualized for an aggressive portfolio [4].
- Dollar-cost averaging buys you lower drawdowns and less regret. It reduces the chance and the size of an early loss, and behavioral research grounded in prospect theory shows loss-averse investors can rationally prefer it even at a lower expected return [5][6].
- Most people never face the choice. Anyone investing from each paycheck is already dollar-cost averaging by default. The lump-sum question only applies when a single sum is sitting in cash waiting for a decision [5].
1. What dollar-cost averaging and lump-sum investing actually mean
Start with the definitions, because the terms get used loosely.
Lump-sum investing means taking the full amount you intend to invest and putting it to work in one move. Dollar-cost averaging means dividing that same amount into equal pieces and investing them on a fixed schedule, say one-twelfth each month over a year, while the uninvested remainder sits in cash [8]. The comparison only makes sense when you already hold the full sum. An investor putting part of each paycheck into a retirement account is not choosing between the two strategies. They are dollar-cost averaging because that is simply how the money arrives [5].
The intuition behind dollar-cost averaging is appealing. By buying at regular intervals you purchase more shares when prices are low and fewer when prices are high, which lowers your average cost per share in a choppy market. The intuition behind lump-sum is colder. If the asset has a positive expected return, the sooner your money is in, the longer it compounds.
Both intuitions are correct. They just answer different questions. One is about the price you pay. The other is about time in the market. The data tells us which one tends to matter more.
2. The base rate: why lump-sum wins about two-thirds of the time
The most cited work on this question is a Vanguard study first published in 2012 under the title "Dollar-Cost Averaging Just Means Taking Risk Later," later refreshed as "Cost averaging: Invest now or temporarily hold your cash?" [1][2]. Vanguard compared investing a lump sum immediately against spreading it over 12 months, across decades of market history in the United States, the United Kingdom, and Australia.
The headline result: lump-sum investing outperformed dollar-cost averaging about two-thirds of the time. In the updated analysis covering 1976 through 2022, the lump-sum approach won between roughly 61.6% and 73.7% of rolling one-year periods depending on the market, with a single global-index illustration landing at about 68% [1][2]. The result held across stock and bond mixes, from a balanced 60/40 portfolio to all equity.
The reason is not complicated, and Vanguard names it plainly. Risky assets have historically out-earned cash most of the time, so phasing in slowly means more of your money spends more of the period in cash, earning less [1]. The strategy quietly bets that the market will be cheaper later. Most of the time, it is not.
Other large managers find the same shape with different numbers. Morgan Stanley examined more than a thousand overlapping seven-year periods and found lump-sum produced higher annualized returns in about two-thirds of cases, with an edge near 0.42% per year for an aggressive allocation over a 12-month phase-in [4]. A 1999 study in the Journal of Economic Dynamics and Control reached the same conclusion on first principles: lump-sum delivers higher expected terminal wealth, while dollar-cost averaging lowers volatility and lowers return [7]. The direction of the finding is stable across studies. Only the magnitude moves.
3. The math: markets rise more often than they fall
The win rate follows directly from a single fact about markets. They go up more often than they go down.
Since 1928 the S&P 500 has finished the calendar year positive in roughly 70% to 73% of years, about seven years up for every three down [3][8]. Over rolling 12-month windows the figure is similar. When the base rate of a positive year is that high, waiting to invest is a bet that the next stretch will be one of the unusual bad ones. That bet has a negative expected payoff.
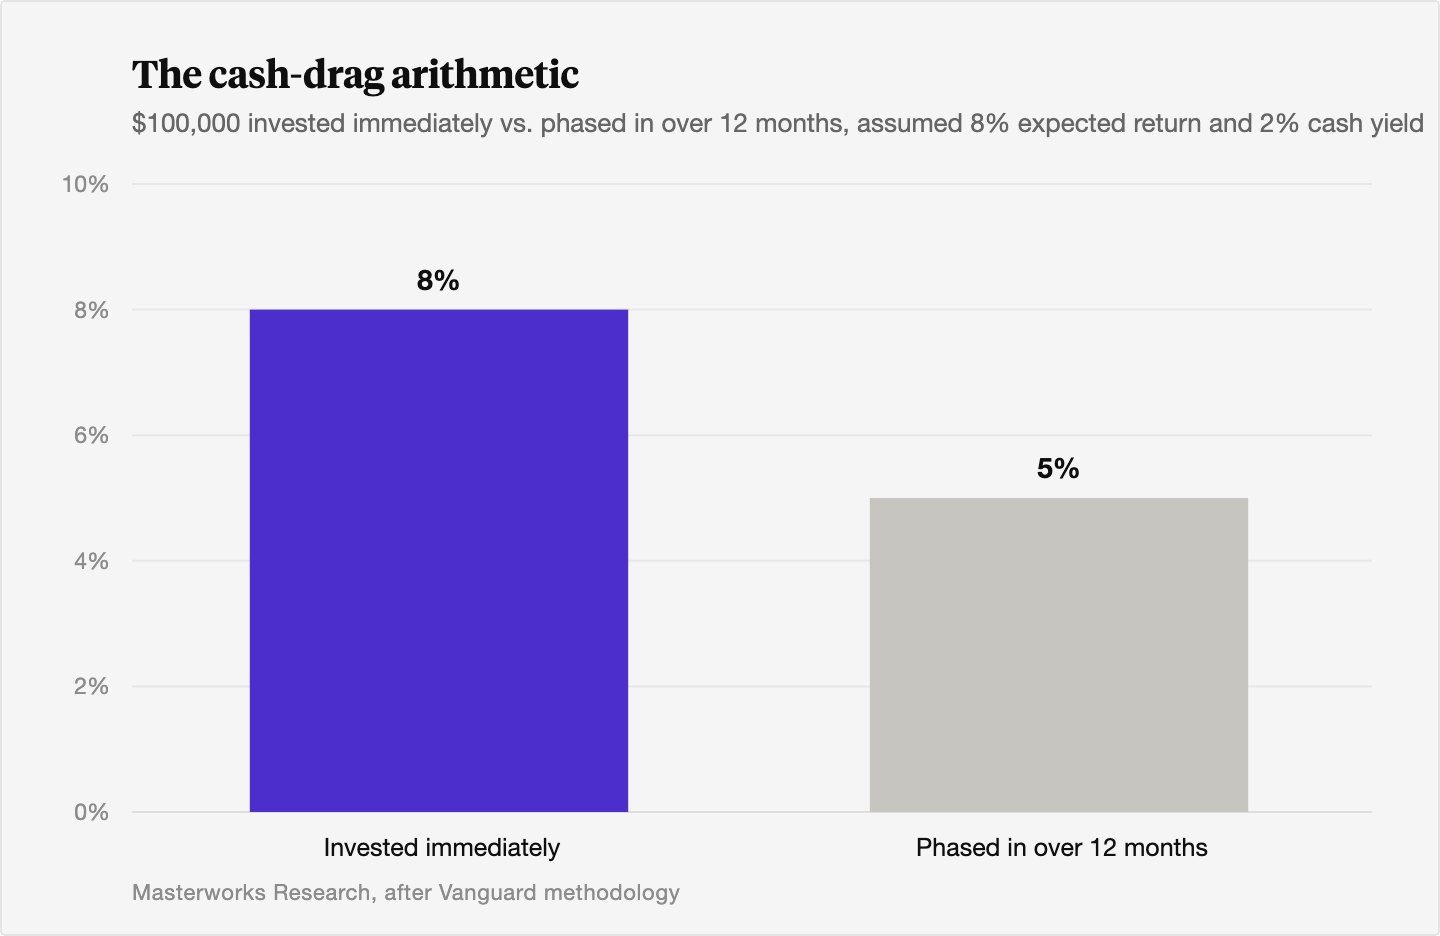
Here is the arithmetic of the cash drag. Suppose your portfolio has an expected return of about 8% a year and cash yields about 2%. If you dollar-cost average a lump sum over 12 months, on average roughly half your money sits in cash across that year. So the blended expected return on the whole sum for that year is about half of 8% plus half of 2%, near 5%, against the 8% the fully invested sum would expect [8]. The gap, close to 3 percentage points on the full amount for that first year, is the price of waiting. It lines up neatly with the 1.2 to 2.4 point advantage Vanguard measured directly [1][2].
We would put the obvious caveat on this directly. These are expected values built on positive average returns, and the average is not the experience. About a third of the time the market falls over the window in question, and in those stretches dollar-cost averaging comes out ahead because the later installments buy in cheaper. Past performance is not predictive of future results. The arithmetic tells you where to bet, not what will happen.
4. The behavioral case: what dollar-cost averaging actually buys you
If lump-sum wins on the math, why does dollar-cost averaging persist? Because expected return is not the only thing investors care about, and for many it is not even the main thing.
Dollar-cost averaging reduces the size of an early loss. Put $100,000 in at once and a 20% drop the next month costs you $20,000 on paper. Phase the same sum in over a year and only a fraction is exposed to that first drop, so the worst peak-to-trough decline on your total capital is smaller [5]. Research on phased entry confirms it lowers both the probability and the magnitude of a large loss during the holding period, at the cost of lower expected ending wealth [5][6].
That trade-off maps onto how people are actually wired. Prospect theory, the work that won Daniel Kahneman a Nobel Prize, shows that losses hurt roughly twice as much as equivalent gains feel good [5][6]. A loss-averse investor who puts everything in the day before a correction does not just lose money. They feel responsible for choosing the wrong day, and that regret often triggers the worst possible follow-up, selling at the bottom. Dollar-cost averaging spreads the entry across many days, so no single date carries the blame. Academic work in behavioral finance finds that loss-averse investors can rationally prefer it even though it gives up expected return [6].
We think that is the honest case for the strategy. It is a discipline against your own worst instincts. A plan you can hold through a downturn beats an optimal plan you abandon at the bottom.
5. When dollar-cost averaging is the right call
The studies point to specific situations where phasing in is the better choice, not the consolation prize.
You are investing from income. This is most people most of the time. Money arriving from each paycheck is invested as it comes, which is dollar-cost averaging by construction. There is no lump sitting in cash to deploy, so the comparison does not apply [5]. Holding those paychecks back to time a better entry is the actual mistake.
You are highly loss-averse or have a short horizon. If a large early drawdown would either force you to sell or genuinely impair a near-term goal, the lower volatility and smaller maximum drawdown of phasing in can outweigh the modest return you give up [5][6]. The same holds if you know yourself well enough to know a sharp loss right after investing would push you to bail.
You need a commitment device. An automated schedule takes the entry decision out of your hands, which protects against both procrastination and the urge to wait for a dip that may never come. For an investor who would otherwise sit in cash for months debating, a mechanical phase-in gets the money working.
The throughline: dollar-cost averaging is the right tool when the risk you most want to manage is your own behavior, or the path of returns, rather than the expected size of the final pile.
6. How this applies to art, where you cannot truly average in
Everything above assumes a divisible, continuously priced, daily-traded asset. Art is none of those things, which is exactly why the lessons translate in a useful and humbling way.
You cannot dollar-cost average into a painting the way you can into an index fund. A work is indivisible, so you cannot buy one-twelfth of a Basquiat each month [9]. There is no continuous price. A work's value is observed only when it actually trades, often through an auction record or a private estimate that may be years stale [9]. And the transaction costs, auction commissions, dealer spreads, insurance, storage, are high enough that mechanically buying and selling small slices on a schedule would erode returns before it averaged anything. True dollar-cost averaging requires a tape. Art does not have one.
The market is also clearly cyclical, and that cuts in the strategy's favor. Global art sales fell about 12% to an estimated $57.5 billion in 2024, then returned to growth, up about 4% to roughly $59.6 billion in 2025, with the recovery concentrated at the high end [9]. The cycle is real, the segments move at different speeds, and even experienced participants struggle to call the turns. This is the same problem the equity data describes. You cannot reliably time a market that rises more often than it falls, and you cannot reliably time one whose price you can only see when something sells.
So the principle survives even though the mechanics do not. You cannot average into a single work, but you can build art exposure gradually, and gradual entry is the part of dollar-cost averaging that actually addresses timing risk. In practice that means staggering purchases across several buying windows rather than committing all at once, and diversifying across artists, periods, and mediums so you are not leaning on one price cycle or one career [9]. Fractional structures, where an investor takes a position in an individual work alongside others, can make that staged, diversified entry possible at sums that buying whole works would not allow, though they carry their own manager, valuation, and liquidity risks that any investor should weigh. We have written more on building art exposure as part of a portfolio in our framework for advisors, on why patience is rewarded in art markets, and on how art market cycles actually work.
The goal of phasing in here is the same one the equity research identifies. You are not trying to beat the market's clock, which the data says you probably cannot. You are spreading your entry points to reduce the penalty from buying everything at one arbitrary moment, in a market where the price you can see today may not exist again tomorrow. Past performance in art, as in stocks, is not predictive of future results, and art is illiquid, long-horizon, and unsuited to anyone who may need the money soon. For a longer look at how the two asset classes have actually performed against each other, see our comparison of art versus stocks over the last 30 years.
The Bottom Line
- Lump-sum investing has beaten a 12-month dollar-cost averaging schedule in roughly two-thirds of historical periods across the major equity markets Vanguard studied, by an average of about 1 to 2 percentage points.
- The reason is arithmetic. Markets finish positive in about 70% of years, so money waiting in cash to be phased in usually gives up return it could have earned.
- Dollar-cost averaging trades a slice of expected return for lower volatility, smaller drawdowns, and less regret. Behavioral research shows loss-averse investors can rationally prefer it.
- Dollar-cost averaging is the natural and correct choice when you invest from income, when a large early loss would force your hand, or when you need a rule to keep yourself invested.
- Art cannot be dollar-cost averaged in the literal sense because works are indivisible, infrequently traded, and costly to transact, but building exposure gradually across works, artists, and vintages applies the same logic of diversifying entry points in a market no one can time.
Sources
- Vanguard. "Cost averaging: Invest now or temporarily hold your cash?" Vanguard Research, 2012 (updated). https://corporate.vanguard.com/content/dam/corp/research/pdf/cost_averaging_invest_now_or_temporarily_hold_your_cash.pdf
- Vanguard. "How to invest a lump sum of money." Vanguard Investor Resources & Education, June 18, 2026. https://investor.vanguard.com/investor-resources-education/online-trading/dollar-cost-averaging-vs-lump-sum
- Western & Southern Financial Group. "Historical S&P 500 Index Performance." January 2025. https://www.westernsouthern.com/-/media/files/distributors/historical-sp500-index-performance-flyer.pdf
- Morgan Stanley. "Dollar-Cost Averaging vs. Lump Sum Investing." Morgan Stanley, April 7, 2025. https://www.morganstanley.com/articles/dollar-cost-averaging-lump-sum-investing
- Fidelity. "Dollar cost averaging." Fidelity Learning Center, May 3, 2025. https://www.fidelity.com/learning-center/trading-investing/dollar-cost-averaging
- Cho, David, and Emre Kuvvet. "Dollar-Cost Averaging: The Trade-Off Between Risk and Return." Journal of Financial Planning, October 2015. https://www.financialplanningassociation.org/article/journal/OCT15-dollar-cost-averaging-trade-between-risk-and-return
- Williams, Richard E., and Peter W. Bacon. "Comparing lump-sum versus dollar-cost average investment strategies." Journal of Economic Dynamics and Control, 1999. https://www.sciencedirect.com/science/article/abs/pii/S0378475499000403
- Thrivent. "Pros & Cons of Dollar-Cost Averaging vs. Lump-Sum Investing." Thrivent Insights, June 1, 2026. https://www.thrivent.com/insights/investing/pros-cons-of-dollar-cost-averaging-vs-lump-sum-investing
- Arts Economics. "The Art Basel and UBS Global Art Market Report 2026" and "The Art Market 2025." Art Basel & UBS, March 2025 and 2026. https://www.artbasel.com/stories/the-art-basel-and-ubs-global-art-market-report-2026
- Titan. "Lump Sum vs Dollar Cost Averaging: Investing Cash." Titan, November 6, 2025. https://www.titan.com/blog/lump-sum-vs-dollar-cost-averaging-how-to-put-cash-to-work
- Flat Fee Advisors. "Dollar Cost Averaging vs. Lump Sum Investing: Which Strategy Wins?" October 30, 2025. https://www.flatfeeadvisors.org/blog/dollar-cost-averaging-vs-lump-sum-investing-which-strategy-wins
- U.S. Bank. "Dollar cost averaging." U.S. Bank Wealth Management Perspectives, 2026. https://www.usbank.com/dam/documents/pdf/wealth-management/perspectives/USB-IS-Dollar-Cost-Averaging.pdf
- Statista. "Art market worldwide, statistics & facts." Statista, May 2024. https://www.statista.com/topics/1119/art-market/
- Artsy. "5 Key Takeaways from Art Basel and UBS's Report, The Art Market 2025." Artsy Editorial, April 8, 2025. https://www.artsy.net/article/artsy-editorial-5-key-takeaways-art-basel-ubss-report-the-art-market-2025
Disclosures
Investing involves risk. Past results are not indicative of future outcomes.
Masterworks is providing this communication as an agent for its issuer entities, not Masterworks Advisers. This material is produced by Masterworks for informational purposes only and does not constitute investment advice, a recommendation, or an offer or solicitation to buy or sell any security. Masterworks is not a licensed broker-dealer by the SEC or FINRA.
Masterworks can only make and accept sales after an offering statement has been filed, and "qualified", by the SEC. Any offers may be revoked before notice of qualification. Indications of interest involve no obligation. For further disclosure visit the offering documents filed with the SEC and Important Disclosures at masterworks.com/cd.
Forward-looking statements and internal estimates are based on assumptions that may prove incorrect, and actual outcomes may differ materially. Figures denoted in brackets are subject to confirmation. Investing in art and alternative assets involves risk, including loss of principal.
Art sales price data is comparative only. Each painting is unique and historical data is not a direct proxy for any specific painting or investment. Data represents whole art, not an investment into our offerings which includes fees and expenses. Any comparative images are not currently live offerings and are provided for educational purposes only.
Masterworks, LLC is located at 1 World Trade Center, 57th Floor, New York, NY 10007.