Masterworks Research · June 2026
What broke in 2022, whether the classic split is actually dead, and the third bucket institutions are adding alongside stocks and bonds.
The 60/40 portfolio is not dead, but the assumption that made it work for forty years did break in 2022, and the largest asset managers in the world have responded by adding a third bucket. The classic mix of 60% stocks and 40% bonds relied on bonds rising when stocks fell. In 2022 both fell together as inflation and interest rate hikes flipped the stock to bond correlation positive, producing one of the worst years for the strategy in two centuries. The portfolio recovered quickly, which is why the "death" framing is contested. The more useful conclusion, in our view, is that a portfolio built on only two assets that can now move together leaves a gap, and firms from BlackRock to KKR are filling it with real assets, private markets, and uncorrelated alternatives. For investors, this matters because it reframes the entire question of what diversification means.
What You Need to Know
- The 60/40 lost roughly 17% in 2022, its worst year since 1937. A standard 60% US equity, 40% US bond portfolio fell about 17.5%, its fourth worst result in 200 years, because stocks and bonds declined at the same time.[1][8]
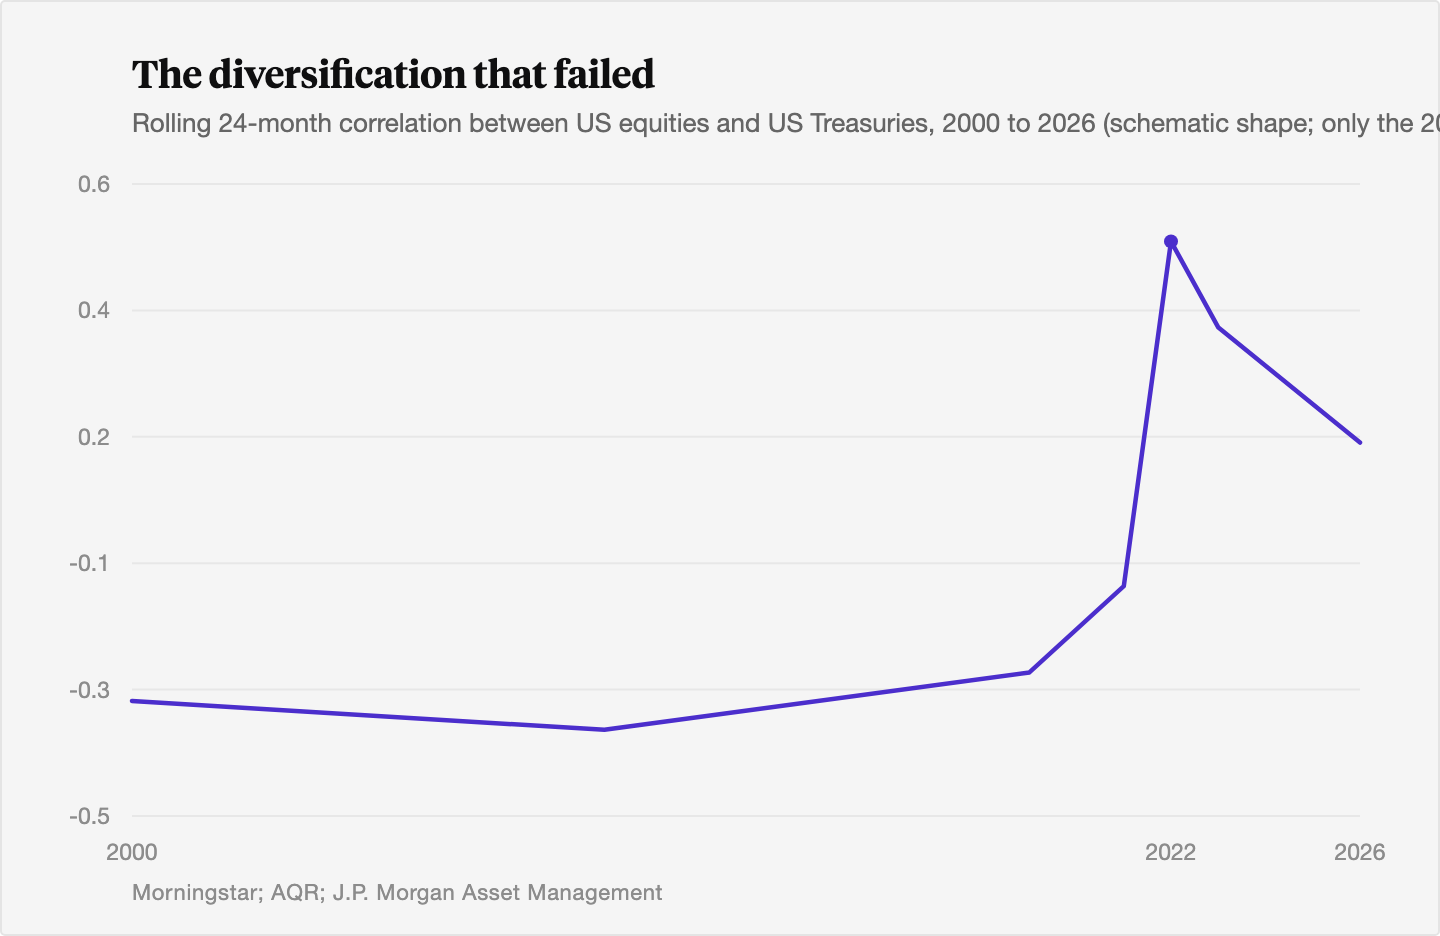
- Bonds stopped working as a shock absorber when inflation took over. The stock to bond correlation, persistently negative for two decades, spiked to roughly +0.50 in 2022, the highest in the modern sample.[2]
- The portfolio rebounded hard, which is why "dead" is contested. A global 60/40 returned about 29.7% cumulatively from the end of 2022 through September 2024, and its trailing 10 year annualized return held near 6.9%.[5][6]
- Institutions answered with a third bucket, not a funeral. BlackRock now frames a 50/30/20 split with 20% in private assets, KKR proposes a 40/30/30 with 30% in alternatives, and J.P. Morgan projects a 60/40 with 30% alternatives lifts the Sharpe ratio about 25%.[3][9][10]
- Blue chip art is one candidate for that third bucket, with caveats. Its historical correlation to stocks and bonds is low, but it is illiquid, yields nothing, carries measurement caveats, and works as a small diversifying sleeve rather than a replacement for either stocks or bonds.[11][12]
1. What the 60/40 portfolio is and why it worked for forty years
The 60/40 portfolio is the simplest version of diversification in practice: put 60% of your money in stocks for growth and 40% in bonds for stability, then rebalance. The idea traces back to the foundations of modern portfolio theory, and for most of the period since the early 1980s it did exactly what it promised. Vanguard data shows the trailing 10 year annualized return for a 60/40 sitting near 6.9%, roughly 10 basis points above its long run average even after a brutal 2022.[5]
The engine underneath was the relationship between the two assets. When equities sold off in a recession or a crisis, central banks cut interest rates, bond prices rose, and the 40% in fixed income cushioned the fall. The two halves moved in opposite directions when it mattered most. From the late 1990s through 2021, the stock to bond correlation was persistently negative, which meant bonds were not just a source of yield. They were insurance.[2]
This is worth being precise about, because the popular shorthand gets it wrong. The point of holding bonds was never that they go up a lot. It was that they tended to go up exactly when stocks went down. That is the property that makes a 40% allocation worth carrying through long stretches where bonds returned very little. For a fuller treatment of why correlation, and not raw return, is the variable that drives diversification, see our piece on correlation and diversification.
2. Why does the stock to bond correlation matter so much?
Diversification is the one thing in investing that can lower risk without lowering expected return, and it works only when the assets you own do not move together. The single number that captures whether stocks and bonds move together is their correlation. When it is negative, the 60/40 is genuinely diversified. When it turns positive, you own one bet wearing two costumes.
The driver of that correlation is the dominant macro force at any given time. In a growth scare or a financial crisis, inflation is low and falling, so the Federal Reserve has room to cut rates aggressively. Bonds rally, stocks fall, and the correlation stays negative. The problem arrives when inflation becomes the dominant variable. As inflation rises above the roughly 2% comfort zone, the correlation becomes less negative and eventually turns positive, because the same rate increases that punish bonds also compress equity valuations.[2] Both assets get repriced by the same lever.
History confirms this is regime dependent rather than permanent. Stocks and bonds were positively correlated from the early 1960s through the late 1990s, a long stretch of elevated inflation and policy uncertainty.[2] The two decades of reliably negative correlation that made the 60/40 feel like a law of nature were, in the long view, the exception. The deeper limits of relying on any single model of diversification are covered in our explainer on modern portfolio theory and its limits.
3. What broke in 2022
2022 was the year the insurance failed. The Federal Reserve raised rates at the fastest pace in decades to fight inflation that had reached levels not seen since the early 1980s, and both sides of the 60/40 fell at once. The S&P 500 dropped about 18%, and the Bloomberg US Aggregate bond index, the standard proxy for the 40%, lost about 13%, its worst year on record.[1] There was no shock absorber, because the shock and the absorber were the same thing.
The result for the blended portfolio was historic. A standard US 60/40 fell roughly 17.5% in 2022, its worst calendar year since 1937 and the fourth worst in 200 years.[1][8] By October 2022 it was on track for what one chief investment officer publicly called its worst year ever.[7] The stock to bond correlation spiked to about +0.50, the highest reading in the modern sample, and equities and bonds declined together for 14 consecutive months.[2]
Even the most sophisticated balanced strategies were exposed. Bridgewater's All Weather portfolio, built explicitly to perform across economic regimes by balancing risk across stocks, bonds, and commodities, drew down about 23.8% into October 2022 when the decades long negative correlation inverted.[4] The commodities sleeve helped, which is the early hint at where the rest of the industry would go next.
4. Is the 60/40 actually dead, or did it just have a bad year?
This is the honest debate, and both sides have real evidence. We will give each its due.
The "it is fine" case rests on what happened next. The 60/40 did not stay broken. A global 60/40 portfolio returned about 29.7% cumulatively from the end of 2022 through September 2024, helped by two straight years of 20% plus equity returns.[5][6] Vanguard's position is that the death narrative is overblown, the product of investors extrapolating two bad years into the future, and that with bond yields reset higher the strategy may produce its typical 5% to 7% annualized going forward.[5][6] On this view, 2022 was a rare simultaneous repricing of both assets after an era of near zero rates, not a permanent failure of the design.
The "it is broken" case is structural rather than about any single year. If the macro regime has shifted toward higher and more volatile inflation, then the negative stock to bond correlation that made 60/40 work cannot be relied on. BlackRock's Larry Fink has argued the classic split "may no longer fully represent true diversification."[3] KKR frames the moment as a regime change in which bonds can no longer be counted on as shock absorbers when paired with equities.[9] The concern is not that 60/40 will never have a good year. It is that its core promise, protection during the bad ones, now carries a question mark.
Our read is that both are right about different things. The 60/40 is a perfectly reasonable core for a long horizon investor, and its long run record survived 2022 intact. The reliability of bonds as a hedge has genuinely weakened. Those two statements can coexist, and the institutional response reflects exactly that.
5. The institutional answer: a third bucket
The largest allocators did not abandon stocks and bonds. They added a third sleeve alongside them. The shorthand has shifted from 60/40 to a three part split, and the numbers are remarkably consistent across firms.
BlackRock, the world's largest asset manager, now points investors toward a 50/30/20 portfolio: 50% stocks, 30% bonds, and 20% private market assets such as real estate, infrastructure, and private credit.[3] KKR proposes a 40/30/30, where the 30% in alternatives splits evenly across private credit, real estate, and infrastructure, with private credit enhancing the bond sleeve and real assets enhancing the equity sleeve through inflation protection.[9] J.P. Morgan's 2026 long term capital market assumptions estimate that adding 30% diversified alternatives to a 60/40 raises the projected annual return to about 6.9% and lifts the Sharpe ratio roughly 25% over the plain version.[10]
The logic behind the third bucket is that it does two jobs the old fixed income allocation can no longer do alone. Real assets like infrastructure and real estate carry inflation protection, the exact thing that hurt bonds in 2022. And uncorrelated alternatives provide diversification that does not depend on the stock to bond relationship holding. J.P. Morgan's same work projects US core real estate near 8.2% and global infrastructure near 6.5% over the next 10 to 15 years.[10] For a full map of the category, see our complete guide to alternative investments for 2026.
6. Where blue chip art fits in the third bucket
Art is one candidate for the uncorrelated portion of that third bucket, and the case rests entirely on correlation. The reason an allocator would consider it is the same reason they reached for real assets and private markets in the first place: it tends to be largely indifferent to the forces driving stocks and bonds. In Deloitte and ArtTactic's 2024 Art & Finance Report, 88% of wealth managers cited art's low correlation with equities as a reason to include it, and roughly half of wealth managers now offer art related services, up from a quarter in 2011.[11][12]
True diversification means owning something that moves to its own rhythm. Art largely does, because what drives its prices is wealth creation at the very top, a different engine than the corporate earnings and interest rates that move public markets. We think of high end art as something close to a call option on the top 1%, and as a portable, global store of value that can be bought in New York and sold in Hong Kong. Its highest historical correlation to a major asset class has been with gold, in the rough range of 0.1 to 0.2, and its correlation to equities over long periods has been close to zero.[11]
Now the discipline. Art is illiquid, with holding periods measured in years rather than days, and a single work can sit for a long time before it finds a buyer. It yields nothing along the way: no coupon, no dividend, only the change in price. The measurement caveats are real, because art indices are built from repeat sales and carry survivorship bias, so historical return figures should be read with care and never as a forecast. And it is small by design. Art belongs as a diversifying sleeve, usually a low single digit percentage of a portfolio to start, not as a replacement for either the equity engine or the bond ballast. It is a candidate for the 20% or 30% third bucket, not for the 60 or the 40. For how advisors are actually sizing and placing it, see our framework for art as an alternative allocation.
A note on how we think about the correlation claim. The credible version is not that art is a hedge that rises when stocks fall. It is that art tends to be indifferent to whatever is moving stocks, which is the property that adds diversification value to a portfolio. An asset that simply went up whenever equities went down would be a lucky bet on timing. Indifference is the more durable and more useful trait.
7. How an investor should actually think about this
Start from what the 60/40 still does well. For a long horizon investor who can hold through drawdowns, a low cost stock and bond portfolio remains a reasonable core, and its multi decade record is strong. The change is not that you should sell it. The change is that you should stop assuming the 40% will always rescue you in a downturn, because in an inflationary regime it may fall alongside your equities.
From there, the institutional template is a guide rather than a prescription. The common thread across BlackRock, KKR, and J.P. Morgan is a third allocation, somewhere in the 20% to 30% range, split between inflation sensitive real assets and genuinely uncorrelated alternatives.[3][9][10] The point of that bucket is to hold something that does not take its orders from the same macro lever as the other two.
We would offer one caution against overcorrecting. The lesson of 2022 is not that diversification failed. It is that a portfolio diversified across only two assets that can now move together is less diversified than it looks. The fix is more genuine diversification, across more sources of return, not a flight into whatever performed best last year. Past performance is not predictive, for stocks, for bonds, or for any alternative.
The Bottom Line
- The 60/40 portfolio worked for forty years because bonds tended to rise when stocks fell, a property that depends on a negative stock to bond correlation.
- In 2022 that correlation turned sharply positive as inflation and rate hikes drove both stocks and bonds down together, producing a roughly 17.5% loss, the worst 60/40 year since 1937.
- The strategy rebounded strongly in 2023 and 2024, so the "death" claim is contested. Its long run annualized return held near 6.9%.
- The structural concern is real: if higher, more volatile inflation persists, bonds may no longer be a dependable hedge for equities.
- The institutional response has been to add a third bucket of real assets, private markets, and uncorrelated alternatives, with BlackRock, KKR, and J.P. Morgan all converging on a 20% to 30% allocation.
- Blue chip art is one candidate for the uncorrelated portion of that bucket. It offers low historical correlation to stocks and bonds, but it is illiquid, yields nothing, carries measurement caveats, and belongs as a small sleeve rather than a replacement for either core asset.
Sources
- Stephens, Charlie. "The 60/40's Annus Horribilis." CAIA Association, February 4, 2023. https://caia.org/blog/2023/02/04/6040s-annus-horribilis
- Benz, Christine, and Amy Arnott. "What Higher Inflation Means for Stock/Bond Correlations." Morningstar, 2025. https://www.morningstar.com/portfolios/what-higher-inflation-means-stock-bond-correlations
- Constable, Simon. "The 60/40 portfolio 'may no longer fully represent true diversification,' BlackRock CEO Larry Fink says." CNBC, April 2, 2025. https://www.cnbc.com/2025/04/02/the-60/40-portfolio-may-no-longer-represent-true-diversification-fink.html
- "The All Weather Strategy in a New Economic Climate." Sophie AI Finance, 2025. https://www.sophie-ai-finance.com/articles/all-weather-strategy-new-economic-climate
- "Vanguard: The 60/40 Portfolio Is Back." ThinkAdvisor, October 25, 2024. https://www.thinkadvisor.com/2024/10/25/vanguard-the-6040-portfolio-is-back/
- Vanguard. "The global 60/40 portfolio: Steady as it goes." Vanguard, 2024. https://corporate.vanguard.com/content/corporatesite/us/en/corp/articles/global-60-40-portfolio-steady-as-it-goes.html
- Fox, Michelle. "Why 60/40 portfolio is on track for its 'worst year ever,' says CIO." CNBC, October 3, 2022. https://www.cnbc.com/2022/10/03/why-60/40-portfolio-is-on-track-for-its-worst-year-ever-says-cio.html
- Ptak, Jeffrey. "The 60/40 Portfolio: A 150-Year Markets Stress Test." Morningstar, 2024. https://www.morningstar.com/economy/6040-portfolio-150-year-markets-stress-test
- KKR. "Regime Change: The Changing Role of Private Real Assets in the 'Traditional' Portfolio." KKR Insights, September 2023. https://www.kkr.com/insights/regime-change-the-changing-role-of-private-real-assets-in-the-traditional-portfolio
- J.P. Morgan Asset Management. "J.P. Morgan Releases 2026 Long-Term Capital Market Assumptions." PR Newswire, October 20, 2025. https://www.prnewswire.com/news-releases/jp-morgan-releases-2026-long-term-capital-market-assumptions-highlighting-resilient-6040-portfolios-and-opportunities-to-enhance-diversification-in-a-new-era-of-economic-nationalism-and-ai-advancement-302589249.html
- Deloitte and ArtTactic. "Art & Finance Report 2025." ArtTactic, 2025. https://arttactic.com/reports/deloitte-and-arttactic-or-art-and-finance-report-2025
- Deloitte Luxembourg. "Art & Finance report: highlights in the art and finance market." Deloitte, 2025. https://www.deloitte.com/lu/en/services/consulting-financial/research/art-finance-report.html
- BlackRock. "Rebuilding 60/40 portfolios with alternatives." BlackRock, 2025. https://www.blackrock.com/us/financial-professionals/insights/60-40-portfolios-alternatives
- J.P. Morgan Asset Management. "Long-Term Capital Market Assumptions." J.P. Morgan Asset Management, 2025. https://am.jpmorgan.com/us/en/asset-management/institutional/insights/portfolio-insights/ltcma/
Disclosures
Investing involves risk. Past results are not indicative of future outcomes.
Masterworks is providing this communication as an agent for its issuer entities, not Masterworks Advisers. This material is produced by Masterworks for informational purposes only and does not constitute investment advice, a recommendation, or an offer or solicitation to buy or sell any security. Masterworks is not a licensed broker-dealer by the SEC or FINRA.
Masterworks can only make and accept sales after an offering statement has been filed, and "qualified", by the SEC. Any offers may be revoked before notice of qualification. Indications of interest involve no obligation. For further disclosure visit the offering documents filed with the SEC and Important Disclosures at masterworks.com/cd.
Forward-looking statements and internal estimates are based on assumptions that may prove incorrect, and actual outcomes may differ materially. Figures denoted in brackets are subject to confirmation. Investing in art and alternative assets involves risk, including loss of principal.
Art sales price data is comparative only. Each painting is unique and historical data is not a direct proxy for any specific painting or investment. Data represents whole art, not an investment into our offerings which includes fees and expenses. Any comparative images are not currently live offerings and are provided for educational purposes only.
Masterworks, LLC is located at 1 World Trade Center, 57th Floor, New York, NY 10007.