Masterworks Research · June 2026
Why the best days cluster near the worst, what the behavior gap costs the average investor, and why a written plan beats a forecast.
Market timing fails because the market's largest single-day gains arrive without warning, cluster right next to its worst days, and tend to land near the bottom of a decline, exactly when a timer has gone to cash. Over the 30 years through June 2025, the S&P 500 returned about 8.45% a year if you stayed fully invested. Miss only the 30 best days and that return falls to roughly 2.07%, below the 2.5% average inflation rate over the same span [1]. The cost of timing is not the trades you get wrong. It is the recoveries you are not present for. For investors, the lesson translates directly: time in the market, a written plan, and steady contributions tend to beat any attempt to predict the turns.
What You Need to Know
- A few days drive most of the return. Missing the 10 best S&P 500 days over the 30 years through June 2025 cut the annual return from 8.45% to 5.56%. Missing the best 50 turned it negative, to about -0.65% [1].
- The best days hide next to the worst. Three of the 30 best days and five of the 30 worst days fell inside the same eight trading days of March 2020. Seven of the 10 best days over the past 20 years occurred within two weeks of the 10 worst [1][3].
- Investors underperform the funds they own. Over the decade through December 2024, the average dollar in US funds earned 7.0% a year while the funds themselves returned 8.2%, a 1.2 point gap traced to the timing of buys and sells [2].
- Bad timing has a price tag. In 2024 the average equity fund investor earned 16.54% against the S&P 500's 25.05%, an 848 basis point shortfall driven by withdrawals in every quarter, the largest just before a return surge [4].
- The professionals miss too. Over the 15 years through December 2024, not one of 22 US equity fund categories had a majority of active managers beat their benchmark [5]. If full-time managers cannot time consistently, individuals should not expect to.
1. Why missing a handful of days breaks a portfolio
Returns are not spread evenly across trading days. They concentrate in a small number of sessions, and being out of the market for those sessions does most of the damage.
Wells Fargo Investment Institute studied the 30 years from July 1, 1995 through June 30, 2025. An investor who stayed fully invested in the S&P 500 earned about 8.45% a year. The same investor who missed only the 10 best days earned 5.56%. Miss the 20 best and the return drops to 3.66%. Miss the 30 best and it falls to 2.07%, below the 2.5% average inflation rate over that period, so the real return turns negative. Miss the 50 best days and the nominal return itself goes negative, to about -0.65% a year [1].
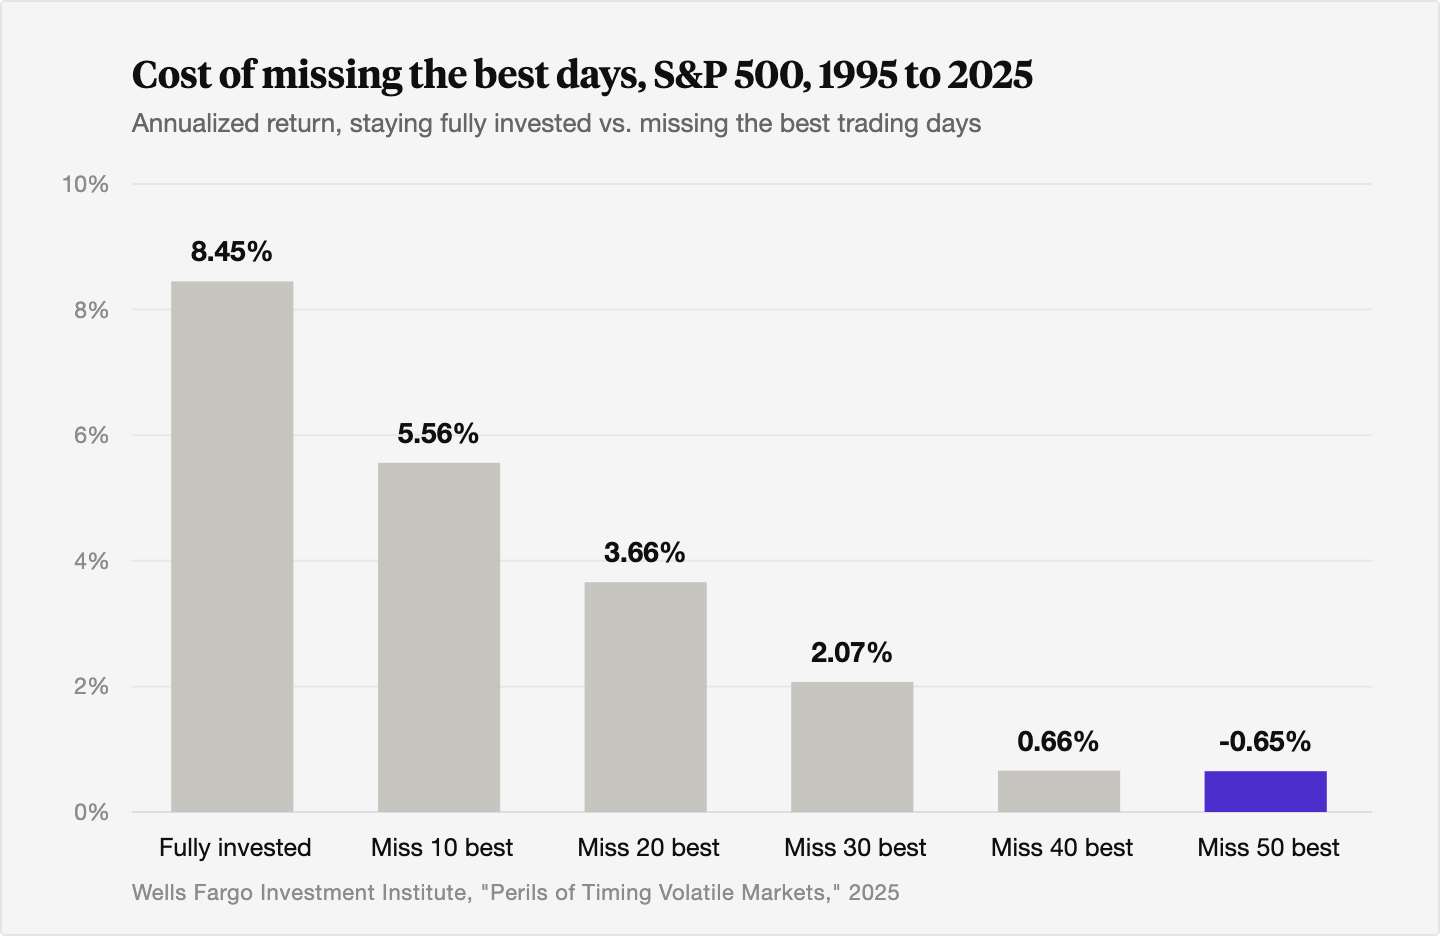
These are not abstract numbers. Fifty days out of roughly 7,560 trading days over three decades is less than 1% of all sessions. Being absent for that 1% is the difference between roughly doubling your money every nine years and barely keeping pace with cash.
2. The best days cluster near the worst
The reason missing days is so costly is structural. The biggest up days do not arrive in calm markets. They arrive in the middle of the scariest ones, often a day or two after the biggest down days.
In the Wells Fargo data, three of the 30 best days and five of the 30 worst days occurred inside a single eight-day window between March 9 and March 18, 2020 [1]. J.P. Morgan Asset Management, looking at the 20 years through 2024, found that seven of the 10 best days fell within two weeks of the 10 worst days [3]. The volatility that triggers the urge to sell is the same volatility that produces the rebound.
Of the 10 best trading days in the Wells Fargo study, nine took place during recessions and six also coincided with a bear market [1]. A separate count found that roughly 78% of the market's best single days happened either during a bear market or in the first weeks of a new bull market, when sentiment was still negative or barely recovering [1]. An investor who sells to avoid the bad days almost guarantees missing the good ones, because they sit on the same dates.
3. The behavior gap: investors trail the funds they own
The clearest evidence that timing fails is not hypothetical. It is the gap between what funds return and what the people who own those funds actually earn.
Morningstar's annual "Mind the Gap" study measures this directly. Over the 10 years through December 31, 2024, the average dollar invested in US mutual funds and ETFs earned 7.0% a year, while the funds themselves posted an 8.2% total return. The 1.2 percentage point shortfall, about 15% of the funds' total return, came from the timing and size of investors' purchases and sales [2]. Funds with the most volatile cash flows lagged their own total returns by about a full point more than funds with the steadiest flows [2]. The more investors traded, the less their average dollar made.
DALBAR's Quantitative Analysis of Investor Behavior reaches the same place from a different angle. In 2024, the average equity fund investor earned 16.54% against the S&P 500's 25.05%, an 848 basis point gap and the second-largest of the decade. DALBAR found withdrawals from equity funds in every quarter of 2024, with the largest outflows landing just before a major upswing. In the firm's words, "It wasn't market performance that held investors back in 2024. It was behavior" [4].
The gap does narrow when investors sit still. DALBAR's 2026 report found that in 2025 the average equity investor earned 17.16% against the S&P 500's 17.88%, a gap of just 72 basis points, the smallest since 2012 [6]. The lesson is consistent in both directions: the years investors trade least are the years they keep the most.
4. The hard part is being right twice
A successful market timer has to make two correct calls, not one. They have to sell before the decline, and they have to buy back before the recovery. Each call is hard on its own. Together they are close to luck.
The exit is the easier half, and it is still hard, because declines are not announced. The re-entry is harder, because the strongest recovery days come early and bunched, as Section 2 showed. A timer who gets out in time but waits for the dust to settle typically waits through exactly the days that matter. J.P. Morgan's figures put numbers on it: over the 20 years through 2024, staying fully invested returned about 10.6% a year, while missing just the 10 best days cut that to roughly 6.4%, close to half the annualized gain [3].
To be clear, market timing works sometimes. The problem is consistency. Getting both calls right once may be skill or luck. Getting them right repeatedly, across cycles, net of taxes and trading costs, is what no large group of investors has been shown to do over long periods.
5. Even the professionals cannot do it consistently
If timing were a learnable edge, full-time managers with research staffs and direct market access would show it. The data says they do not.
The S&P SPIVA Scorecard tracks active funds against their benchmarks. For 2024, 65% of active large-cap US equity funds underperformed the S&P 500, worse than the 60% rate in 2023 and near the 64% long-run average across 24 years of scorecards [5]. Underperformance widens with time. Over the 15 years through December 2024, not a single one of 22 US equity fund categories had a majority of active managers beat their benchmark [5]. The companion Persistence Scorecard shows that the rare managers who do outperform in one period seldom repeat it.
We read this as a humility check. The people whose full-time job is to beat the market, with every tool individuals lack, fail to do so most of the time and almost never repeatedly. An individual trading a brokerage account on weekends is unlikely to find an edge that the professional field cannot hold.
6. What to do instead, part one: a plan and time in the market
The constructive answer is a written plan that removes the need to forecast at all.
Start with an investment policy you write down when markets are calm: your target mix of stocks, bonds, and alternatives, the reasons for each, and the rules for when you will and will not change it. The point of writing it down is that a document does not panic. When the next March 2020 arrives, the plan, not the headlines, tells you what to do.
The second piece is time in the market. The Wells Fargo and J.P. Morgan figures in Sections 1 through 4 are all arguments for staying invested through the noise, because the cost of being out for the best days dwarfs the cost of sitting through the worst ones. Time in the market beats timing the market because compounding rewards presence, and the best days cannot be scheduled. For more on why long horizons do the heavy lifting in illiquid assets specifically, see our piece on why patience is rewarded in art markets.
7. What to do instead, part two: contributions, rebalancing, and diversification
A plan needs mechanics. Three durable ones replace timing with process.
Dollar-cost averaging. Investing a fixed amount on a fixed schedule, through every market, takes the timing decision out of your hands. You buy more shares when prices are low and fewer when they are high, and you never have to guess the bottom. There is a real tradeoff with investing a lump sum all at once, which has historically captured more upside on average because markets rise more often than they fall. We compare the two directly in dollar-cost averaging vs lump-sum investing.
Rebalancing. Setting target weights and periodically trimming what has run up to buy what has lagged is the disciplined opposite of chasing performance. It enforces selling high and buying low on a calendar, not on a hunch, and it keeps risk from drifting as one asset balloons.
Diversification. Spreading capital across assets that do not move together is the closest thing to a free lunch in investing. The goal is to own things driven by different forces, so that no single shock controls the whole portfolio. True diversification means holding an asset largely indifferent to whatever is moving everything else. Art is one such asset, with a correlation to equities near zero over long periods and its highest correlation, to gold, only around 0.1 to 0.2. We lay out the long-run comparison in art vs stocks over the last 30 years.
Each of these works for the same reason: it converts an emotional decision into a rule. The biases that make timing tempting, loss aversion and recency chief among them, are well documented, and a rule is how you protect a portfolio from them. We catalog the relevant ones in behavioral finance: the biases that cost investors money.
8. Match the asset to the time horizon
The last piece of the plan is fitting each holding to when you will need the money. Cash you need next year does not belong in stocks. Money you will not touch for a decade can absorb volatility, and over a decade volatility is the price of the return, not a reason to avoid it.
This is where illiquid real assets earn their place. An asset you cannot sell tomorrow forces the long horizon that the data says works, by removing the option to react. The discipline is built into the structure. The match also runs the other way: do not put money you may need soon into something that takes years to sell well.
We believe this is why patience tends to be rewarded in art, and why the case against timing is even stronger there than in public markets. The next section makes that bridge explicit.
9. The same lesson, harder, in art and other illiquid assets
The argument against market timing is sharpest in assets where timing is barely possible. Art is a clean example.
Public stocks at least give a timer the raw materials to try: a daily price, instant liquidity, and low trading costs. Art offers none of them. There is no daily quote, so you cannot watch for a top. Transaction costs run high, with auction buyer's premiums and seller's commissions that can together reach a meaningful share of the price, so churning destroys return. And a sale can take months to arrange and close, so you cannot exit on a signal even if you had one. Every feature that makes timing hard in equities is more extreme in art.
For a long-horizon investor, that illiquidity is the point. The art market runs on its own clock, and it has historically taken years to work through a correction and recover. An owner who must hold through that cycle captures the recovery by default, because the structure denied them the chance to sell at the bottom. The forced patience that frustrates a trader is the same patience the data rewards.
We want to be measured here. None of this implies a guaranteed return, in art or anywhere else, and past performance is not predictive of future results. Art is illiquid, concentrated, and carries real risk of loss. The narrow claim is this: in an asset where you cannot time, a long-horizon, hold-through-cycles approach is close to the only sound approach, which is why we keep coming back to time in the market over timing it.
The Bottom Line
- Missing a small number of the market's best days does most of the damage to long-run returns, and those best days cluster right next to the worst ones, so selling to dodge declines tends to forfeit the recovery.
- The behavior gap is real and measured: investors have historically trailed the very funds they own, and the gap narrows in the years they trade least.
- Being a successful timer requires being right twice, on the exit and the re-entry, and even professional managers fail to time consistently over long periods, per SPIVA.
- The constructive alternative is a written plan, time in the market, dollar-cost averaging, rebalancing, diversification, and matching each asset to its time horizon.
- In illiquid assets like art, timing is harder still, so a long-horizon approach dominates by default, though it carries real risk and offers no guaranteed return.
Sources
- Wells Fargo Investment Institute. "Perils of Timing Volatile Markets." 2025. https://www.wellsfargoadvisors.com/research-analysis/reports/policy/volatile-markets.htm
- Morningstar. "Mind the Gap 2025: The More Investors Traded, the Less Their Average Dollar Made." August 2025. https://www.morningstar.com/business/insights/research/mind-the-gap
- J.P. Morgan Asset Management. "Navigating Market Volatility: A Guide for Retirement Investors (Guide to Retirement)." 2025. https://am.jpmorgan.com/us/en/asset-management/adv/insights/retirement-insights/navigating-market-volatility-retirement-guide/
- DALBAR. "Investors Missed the Best of 2024's Market Gains, Latest QAIB Report Finds." March 31, 2025. https://www.dalbar.com/press-release/investors-missed-the-best-of-2024s-market-gains-latest-dalbar-investor-behavior-report-finds/
- S&P Dow Jones Indices. "SPIVA U.S. Scorecard Year-End 2024." March 2025. https://www.spglobal.com/spdji/en/spiva/article/spiva-us-year-end-2024/
- DALBAR. "DALBAR's 2026 QAIB Report Shows Narrower Investor Gap Amid a Complex and Volatile Market Year." April 17, 2026. https://www.prnewswire.com/news-releases/dalbars-2026-qaib-report-shows-narrower-investor-gap-amid-a-complex-and-volatile-market-year-302745998.html
- Morningstar. "Investors Still Need to Mind the Gap in Their Funds' Returns." 2025. https://www.morningstar.com/funds/investors-still-need-mind-gap-their-funds-returns
- PLANADVISER. "Investors' Bad Behavior Led to Sharp Underperformance in 2024." 2025. https://www.planadviser.com/investors-bad-behavior-led-sharp-underperformance-2024/
- S&P Dow Jones Indices. "SPIVA U.S. Year-End 2025." 2026. https://www.spglobal.com/spdji/en/spiva/article/spiva-us/
- CNBC. "Selling Out During the Market's Worst Days Can Hurt You, Research Shows." April 7, 2025. https://www.cnbc.com/2025/04/07/selling-out-during-the-markets-worst-days-can-hurt-you-research.html
- The Motley Fool Wealth Management. "Timing the Market Can Often Mean Missing the Best Days." 2025. https://foolwealth.com/hubfs/one-pager/timing-the-market.pdf
- 401k Specialist. "Market Timing Folly Explained in JPMAM Guide to Retirement." 2024. https://401kspecialistmag.com/folly-of-timing-the-market-explained-in-jpmams-2024-guide-to-retirement/
Disclosures
Investing involves risk. Past results are not indicative of future outcomes.
Masterworks is providing this communication as an agent for its issuer entities, not Masterworks Advisers. This material is produced by Masterworks for informational purposes only and does not constitute investment advice, a recommendation, or an offer or solicitation to buy or sell any security. Masterworks is not a licensed broker-dealer by the SEC or FINRA.
Masterworks can only make and accept sales after an offering statement has been filed, and "qualified", by the SEC. Any offers may be revoked before notice of qualification. Indications of interest involve no obligation. For further disclosure visit the offering documents filed with the SEC and Important Disclosures at masterworks.com/cd.
Forward-looking statements and internal estimates are based on assumptions that may prove incorrect, and actual outcomes may differ materially. Figures denoted in brackets are subject to confirmation. Investing in art and alternative assets involves risk, including loss of principal.
Art sales price data is comparative only. Each painting is unique and historical data is not a direct proxy for any specific painting or investment. Data represents whole art, not an investment into our offerings which includes fees and expenses. Any comparative images are not currently live offerings and are provided for educational purposes only.
Masterworks, LLC is located at 1 World Trade Center, 57th Floor, New York, NY 10007.