Masterworks Research · June 2026
How rising home and stock values feed through into spending, how that channel transmits monetary policy, and why the effect is most concentrated at the top of the wealth distribution, where art demand lives.
The wealth effect is the tendency of households to spend more when the value of what they own goes up, and less when it falls. Economists measure it as the marginal propensity to consume out of wealth: the extra cents of annual spending a household generates for each additional dollar of wealth. The consensus from the research is that the effect is real but modest, roughly 3 to 5 cents of extra annual spending per dollar of housing wealth in the long run, and smaller for stock-market wealth. For investors, the channel matters because it is one of the main ways asset prices feed back into the real economy, and because it concentrates at the very top of the wealth distribution, which is the same place demand for art and other luxury assets is created.
What You Need to Know
- The wealth effect is the marginal propensity to consume out of wealth. Households treat part of a rise in asset values as spendable. Estimates for housing center on roughly 3 to 5 cents per dollar in the long run, with some studies finding the eventual effect closer to 9 cents.[1][2]
- Housing generally drives more spending than stocks. Case, Quigley, and Shiller found a housing-wealth elasticity of consumption near 0.11, against an effect from stock wealth that was small and often not statistically different from zero.[3]
- It transmits monetary policy. When a central bank eases, asset prices rise, and the wealth effect is one of the channels that turns lower rates into more household spending. Federal Reserve staff estimates of the housing channel have ranged from about 2.9 cents in the 1970s to 8.4 cents in the 1980s.[4][5]
- It runs in reverse during downturns. In the 2008 crisis, Mian and Sufi estimated consumption fell roughly 5 to 7 cents for every dollar of lost housing net worth, and US household wealth dropped about $11 trillion from its 2007 peak.[6]
- The top of the distribution does most of the spending. The top 10% of US earners accounted for an estimated 49.2% of consumer spending in 2025, the highest share in data going back to 1989, and that cohort is the most sensitive to equity prices.[7][8]
1. What the wealth effect actually is
Start with the definition, because the term gets used loosely. The wealth effect is the change in consumer spending that follows a change in household wealth, holding income roughly constant. The standard way to size it is the marginal propensity to consume out of wealth, often shortened to the MPC out of wealth. If a household raises its annual spending by 4 cents for every extra dollar of net worth, its MPC out of that wealth is 0.04.
A note on how economists know this. The cleanest estimates come from life-cycle and permanent-income models, where households smooth consumption against expected lifetime resources, and from panel data that tracks spending against wealth across regions and over time. The work most often cited here is Carroll, Otsuka, and Slacalek, who built a method that separates the immediate response from the eventual one by exploiting the well-documented sluggishness of consumption growth. Their estimate: an immediate MPC out of housing wealth of about 2 cents per dollar, rising to around 9 cents in the long run.[2]
The reason the effect is modest rather than dollar-for-dollar is straightforward. Wealth is stock, and spending is flow. A household that gains $100,000 in home value does not spend $100,000. It spreads a small slice of that gain across many years of higher consumption, and it discounts gains it suspects are temporary. That is why even the larger long-run estimates land in single-digit cents.
2. Why housing usually drives more spending than stocks
The literature is fairly consistent that the housing wealth effect is larger than the stock-market wealth effect. Case, Quigley, and Shiller, in the canonical study on this question, found that a 1% rise in housing wealth was associated with consumption higher by roughly 0.11%, an elasticity in the range of 0.11 to 0.17 in their international panel, while the comparable effect from stock-market wealth was small and frequently not statistically distinguishable from zero.[3] Their US state-level work put the housing elasticity in a range of about 0.03 to 0.18 with a central estimate near 0.08.[1]
Three structural reasons explain the gap.
First, distribution. Home equity is spread across the middle of the income distribution, where the propensity to spend out of any given dollar is higher. Stock wealth is concentrated among high earners, who already fund their consumption comfortably and treat a marginal dollar of paper gains as savings.
Second, perceived permanence. Households tend to read a higher home value as a durable change in their circumstances and a higher stock portfolio as something that can reverse next quarter. Spending responds more to wealth that feels lasting.
Third, access. Rising home values can be borrowed against directly through refinancing and home-equity lines, which turns paper gains into cash in hand. Mian and Sufi documented roughly $1.25 trillion of borrowing against higher home values between 2002 and 2006, much of it spent.[6] Equity gains are easier to spend only after a sale.
The practical takeaway is that not all asset appreciation moves the economy equally. A dollar created in the housing market generally does more work on Main Street than a dollar created on Wall Street.
3. How big is the effect, in cents
Pulling the estimates together gives a usable range rather than a single number, which is honest to how the research actually reads.
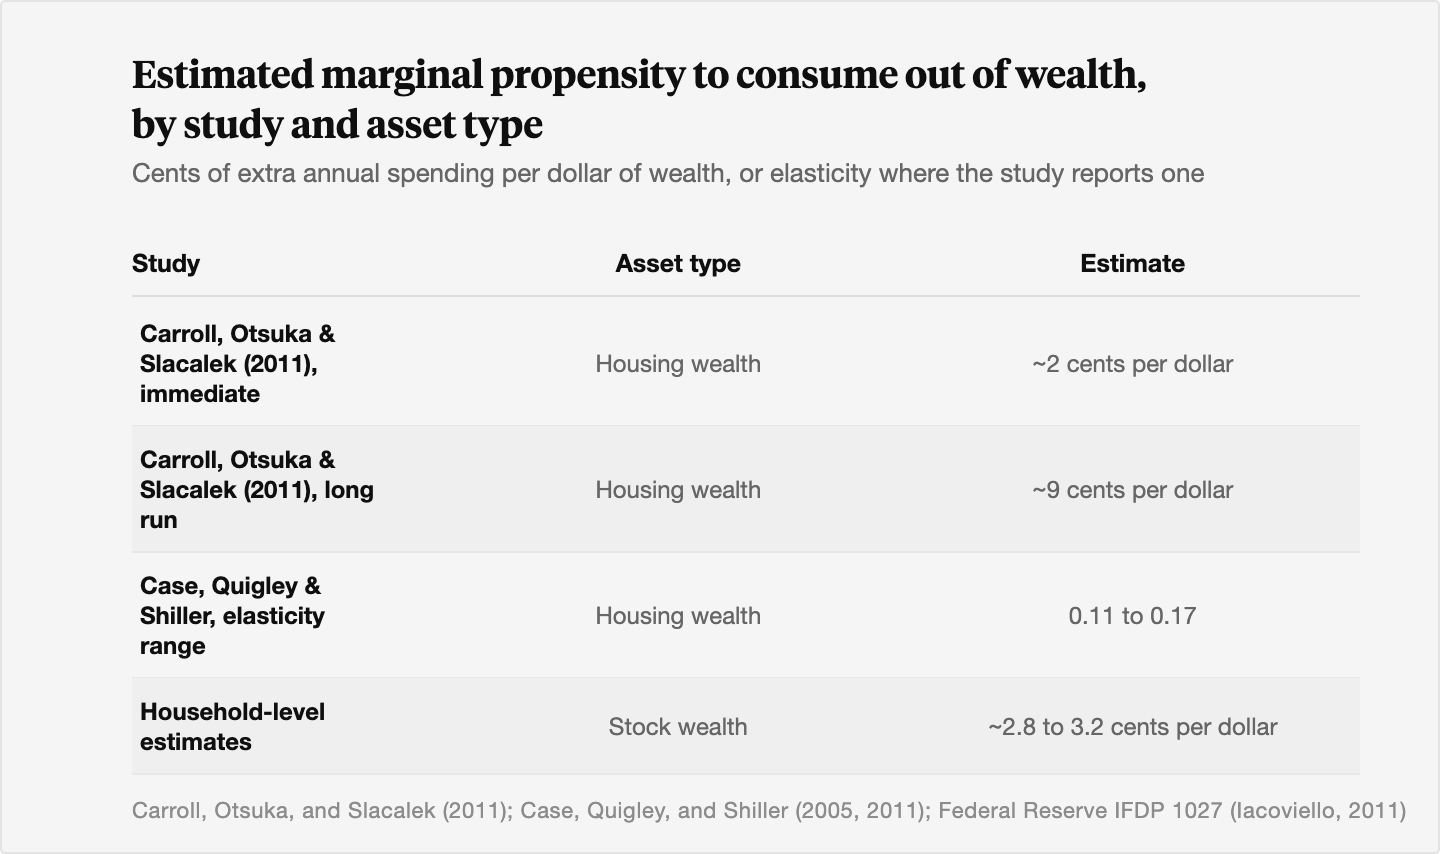
For housing, the central tendency sits around 3 to 5 cents per dollar over a multi-year horizon, with the immediate response closer to 2 cents and some long-run estimates reaching about 9 cents.[1][2] A simple regression in the Federal Reserve's own work put the housing elasticity near 0.14, which the authors translated to roughly 6 cents per dollar, against about 2 cents for non-housing wealth.[1] The Fed's FRB/US model has used a range of 5 to 10 cents on the dollar for net tangible assets.[1]
For equities, the estimates are lower and noisier. Some studies of stock-market wealth find an annual MPC in the low single digits, around 2.8 to 3.2 cents per dollar at the household level in specific settings, while the broad cross-country and state-level evidence often finds the aggregate stock effect statistically weak.[3] The honest summary is that the housing effect is the more reliable of the two, and the stock effect is real but smaller and harder to pin down.
We would treat these as orders of magnitude, not precision figures. The estimates move with the dataset, the time period, and the method.
4. How the wealth effect transmits monetary policy
This is where the channel earns its place in macro. When a central bank cuts rates, it is not only making borrowing cheaper. Lower rates lift the present value of future cash flows, so stock prices and home values tend to rise. The wealth effect then converts those higher asset values into higher household spending. Frederic Mishkin, in his work for the Federal Reserve and the NBER, treats this as one of the standard life-cycle channels of the monetary transmission mechanism, alongside the direct cost-of-capital and balance-sheet channels.[4][5]
The size of this channel has been debated inside the Fed itself. Staff estimates of the propensity to spend out of real-estate wealth ranged from about 2.9 cents per dollar in the 1970s to about 8.4 cents in the 1980s, and later work generally found the wealth channel to be weaker than older structural models implied.[4] The direction is settled even where the magnitude is not: easier policy raises asset prices, and higher asset prices raise spending at the margin.
For an investor reading the macro tape, the implication is that asset markets are not just a scoreboard. They are part of the plumbing. A sustained rise in equity and home values is, by itself, mildly stimulative, and a sustained fall is mildly contractionary, before any other policy lever moves.
5. The reverse, or negative, wealth effect in downturns
The wealth effect is symmetric in theory and brutal in practice. When asset prices fall, households cut back, and the cut is sharpest where household debt is highest.
The 2008 crisis is the case study. US household wealth fell from a peak near $61.4 trillion in the second quarter of 2007 to about $50.4 trillion by the first quarter of 2009, a roughly $11 trillion decline.[6] Atif Mian and Amir Sufi, whose county-level work is the standard reference here, estimated that consumption fell by roughly 5 to 7 cents for every dollar of lost housing net worth, and that the counties with the largest run-up in household debt from 2002 to 2006 saw the steepest declines in durable spending starting as early as the third quarter of 2006.[6] The negative wealth effect, amplified by debt, is a large part of why the recession was as deep as it was.
The lesson for portfolio construction is uncomfortable but useful. The same mechanism that makes rising markets feel like a tailwind makes falling markets feel like a vise, and it does so through spending, not just sentiment. That argues for owning assets whose prices are not tightly coupled to the same forces driving equities and housing.
6. Why the effect concentrates at the top
The aggregate wealth effect is an average, and averages hide where the action is. In the current US economy, spending is heavily concentrated. Moody's Analytics chief economist Mark Zandi estimated that the top 10% of US earners accounted for 49.2% of all consumer spending in the second quarter of 2025, the highest share in data going back to 1989, up from roughly 35% in the early 1990s.[7][8]
That same cohort is the most exposed to equity markets. The typical stockholder in the top 10% by income held about $1.1 million in stock in the third quarter of 2025, up from $624,000 at the end of 2022.[7] When the market rises, this group feels wealthier and keeps spending. When it falls and stays down, this group pulls back, and because it carries roughly half of all consumption, its caution can tip the broader economy. Zandi's blunt framing is that the economy's near-term path now rests heavily on whether affluent households keep spending.[7][8]
This is the bridge to the art market, and it is worth stating plainly rather than overselling.
7. What this means for the art market
Demand for art is created at the top of the wealth distribution, which is exactly where the stock-market wealth effect lands hardest. The Art Basel and UBS surveys put high-net-worth individuals at an average art allocation of about 20% of wealth in 2025, rising to roughly 28% among collectors with assets above $50 million.[9] These are the same households whose discretionary spending tracks their equity portfolios most closely.
We think about this as a call option on the top 1%. A serious collection runs into the tens of millions, so the marginal buyer of a major work is effectively a billionaire, and what funds that purchase is wealth creation at the very top. When equity values rise, top-end wealth rises, the wealth effect lifts luxury and discretionary spending, and art demand is one of the categories that benefits. The 2025 recovery showed the high end leading: global art sales rose about 4% to an estimated $59.6 billion, and the strongest gains by value were in the most expensive works, the segment most tied to ultra-wealthy buyers.[9][10]
Now the honest limits, because the connection is real but loose.
The art market does not move in lockstep with equities. Its correlation to stocks over long periods is roughly zero, and its highest correlation, with gold, is only around 0.1 to 0.2. That low coupling is the entire diversification case for art, and it cuts against any claim that art simply rides the stock-market wealth effect. The link is concentrated around cycle turns. When a sustained equity drawdown erodes top-end paper wealth, discretionary and luxury budgets tighten with a lag, and the high end of the art market tends to soften some quarters later. When wealth recovers, the high end leads back. The wealth effect is one demand driver behind those turns, working through the same affluent households, but it sits alongside supply dynamics, taste, and the structure of the auction calendar. We would not overstate it. Art is influenced by top-end wealth and equity cycles at the margins, and it is largely indifferent to them in between. That is the useful part.
For a fuller treatment of those cycle mechanics, see our explainer on how art market cycles work, the long-run return comparison in art vs stocks over the last 30 years, why the same affluent cohort matters for demand in the great wealth transfer, and the broader real-asset case in fiscal dominance and hard assets.
The Bottom Line
- The wealth effect is the marginal propensity to consume out of wealth, and it is modest: roughly 3 to 5 cents of extra annual spending per dollar of housing wealth in the long run, and smaller for stocks.
- Housing generally drives more spending than equities, because home equity sits with middle-income households, feels more permanent, and can be borrowed against directly.
- The effect is a real channel for monetary policy. Easier policy lifts asset prices, and higher asset prices raise spending at the margin.
- It runs in reverse during downturns. The 2008 episode cut consumption by an estimated 5 to 7 cents per dollar of lost housing wealth and helped deepen the recession.
- Spending and equity exposure are both concentrated at the top, where the top 10% of earners now account for roughly half of US consumption and the demand for art is created.
- Art is one luxury category influenced by top-end wealth and equity cycles around their turns, while staying largely uncorrelated in between. That low correlation, not the wealth-effect link, is the diversification case.
Sources
- Iacoviello, Matteo. "Housing Wealth and Consumption." Board of Governors of the Federal Reserve System, International Finance Discussion Papers No. 1027, 2011. https://www.federalreserve.gov/pubs/ifdp/2011/1027/ifdp1027.htm
- Carroll, Christopher D., Misuzu Otsuka, and Jirka Slacalek. "How Large Are Housing and Financial Wealth Effects? A New Approach." European Central Bank Working Paper No. 1283, 2011. https://www.ecb.europa.eu/pub/pdf/scpwps/ecbwp1283.pdf
- Case, Karl E., John M. Quigley, and Robert J. Shiller. "Comparing Wealth Effects: The Stock Market versus the Housing Market." NBER Working Paper No. 8606, 2001. https://www.nber.org/system/files/working_papers/w8606/w8606.pdf
- Federal Reserve Board. "How Has the Monetary Transmission Mechanism Evolved Over Time?" Finance and Economics Discussion Series 2010-26. https://www.federalreserve.gov/pubs/feds/2010/201026/201026pap.pdf
- Mishkin, Frederic S. "Housing and the Monetary Transmission Mechanism." NBER Working Paper No. 13518, 2007. https://www.nber.org/papers/w13518
- Mian, Atif, and Amir Sufi. "Household Balance Sheets, Consumption, and the Economic Slump." NBER / Princeton, 2012. https://www.stern.nyu.edu/sites/default/files/assets/documents/con_040504.pdf
- Picchi, Aimee. "Top 10% of earners drive a growing share of US consumer spending." Marketplace, September 17, 2025. https://www.marketplace.org/story/2025/09/17/top-10-of-earners-make-up-half-of-us-retail-spending
- Fortune / Moody's Analytics (Mark Zandi). "The economy's prospects are reliant on the fortunes of the well-to-do, says Moody's." Fortune, September 17, 2025. https://fortune.com/2025/09/17/economy-reliant-on-wealthy-consumer-moodys-consumer-spending/
- McAndrew, Clare. "The Art Basel and UBS Survey of Global Collecting 2025." Arts Economics / UBS, 2025. https://www.ubs.com/global/en/our-firm/art/2025/global-collecting-2025.html
- McAndrew, Clare. "The Art Basel and UBS Global Art Market Report 2026." Art Basel and UBS, 2026. https://www.artbasel.com/stories/the-art-basel-and-ubs-global-art-market-report-2026
- Poterba, James M. "Stock Market Wealth and Consumption." Journal of Economic Perspectives, Vol. 14 No. 2, 2000. https://economics.mit.edu/sites/default/files/publications/jep.14.2.99.pdf
- National Bureau of Economic Research. "New Estimates of the Stock Market Wealth Effect." NBER Digest, August 2019. https://www.nber.org/digest/aug19/new-estimates-stock-market-wealth-effect
Disclosures
Investing involves risk. Past results are not indicative of future outcomes.
Masterworks is providing this communication as an agent for its issuer entities, not Masterworks Advisers. This material is produced by Masterworks for informational purposes only and does not constitute investment advice, a recommendation, or an offer or solicitation to buy or sell any security. Masterworks is not a licensed broker-dealer by the SEC or FINRA.
Masterworks can only make and accept sales after an offering statement has been filed, and "qualified", by the SEC. Any offers may be revoked before notice of qualification. Indications of interest involve no obligation. For further disclosure visit the offering documents filed with the SEC and Important Disclosures at masterworks.com/cd.
Forward-looking statements and internal estimates are based on assumptions that may prove incorrect, and actual outcomes may differ materially. Figures denoted in brackets are subject to confirmation. Investing in art and alternative assets involves risk, including loss of principal.
Art sales price data is comparative only. Each painting is unique and historical data is not a direct proxy for any specific painting or investment. Data represents whole art, not an investment into our offerings which includes fees and expenses. Any comparative images are not currently live offerings and are provided for educational purposes only.
Masterworks, LLC is located at 1 World Trade Center, 57th Floor, New York, NY 10007.