
Masterworks Research · June 2026
The scale and timing of the largest handoff of capital in history, how heir preferences differ from their parents', and why the asset-allocation map is being redrawn.
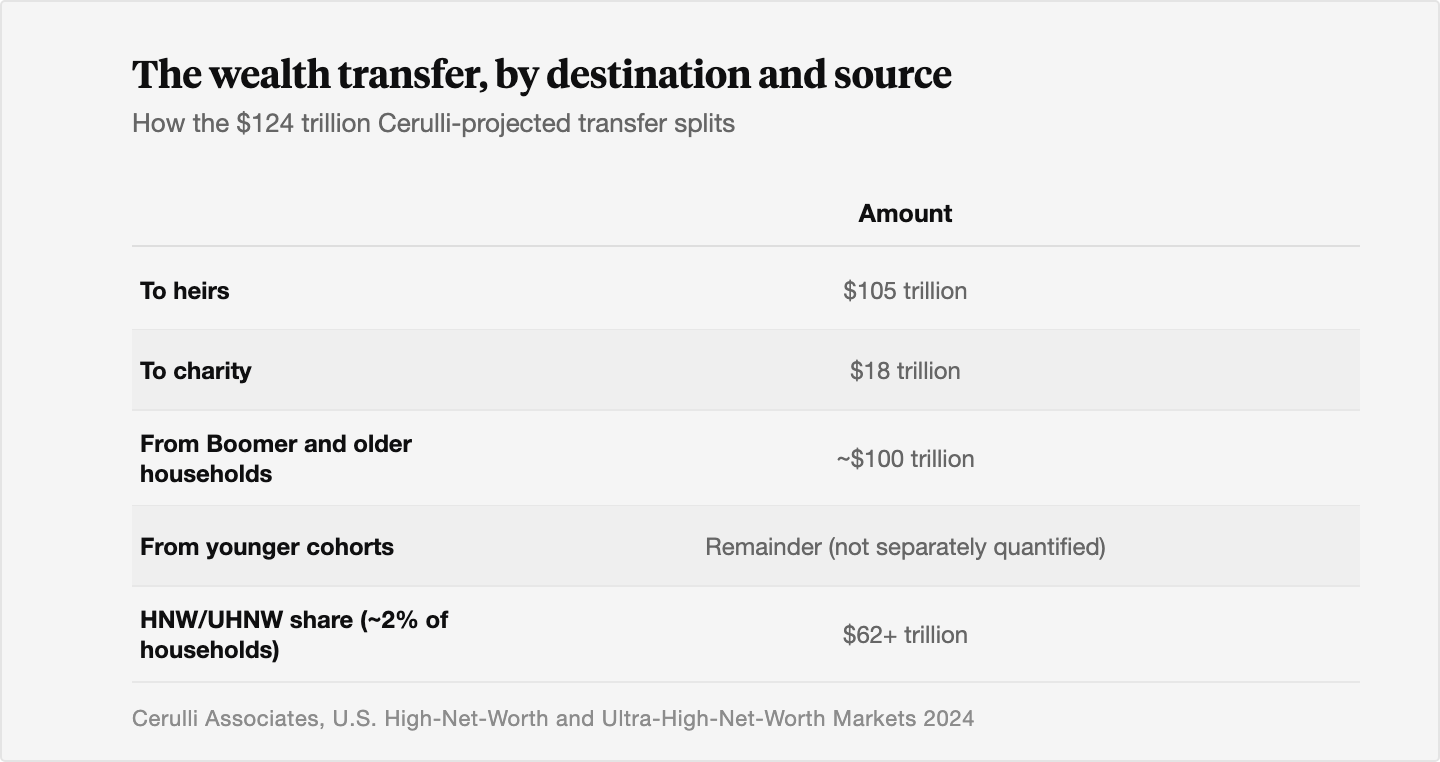
The great wealth transfer is the movement of household wealth from Baby Boomers and the Silent Generation to their heirs, spouses, and charities over the next two decades. Cerulli Associates puts the figure at $124 trillion through 2048, with $105 trillion flowing to heirs and $18 trillion to charity. The handoff is heavily concentrated at the top. Households already classified as high net worth or ultra high net worth, about 2% of the total, account for more than half of the dollars in motion. For an investor, the number itself is less useful than what sits underneath it. The people receiving this money allocate differently than the people who made it, and that gap is where the consequences live.
What You Need to Know
- The headline figure has grown, and the window is real. Cerulli's original estimate was $84.4 trillion through 2045. Its 2024 refresh raised that to $124 trillion through 2048 [1][2]. Most of the dollars move within the next 10 to 20 years as the Boomer cohort ages.
- The money is concentrated, not spread evenly. More than $62 trillion, over half the total, comes from the roughly 2% of households that are HNW or UHNW [1]. The transfer is a top-heavy event, and the top is where alternative assets already sit.
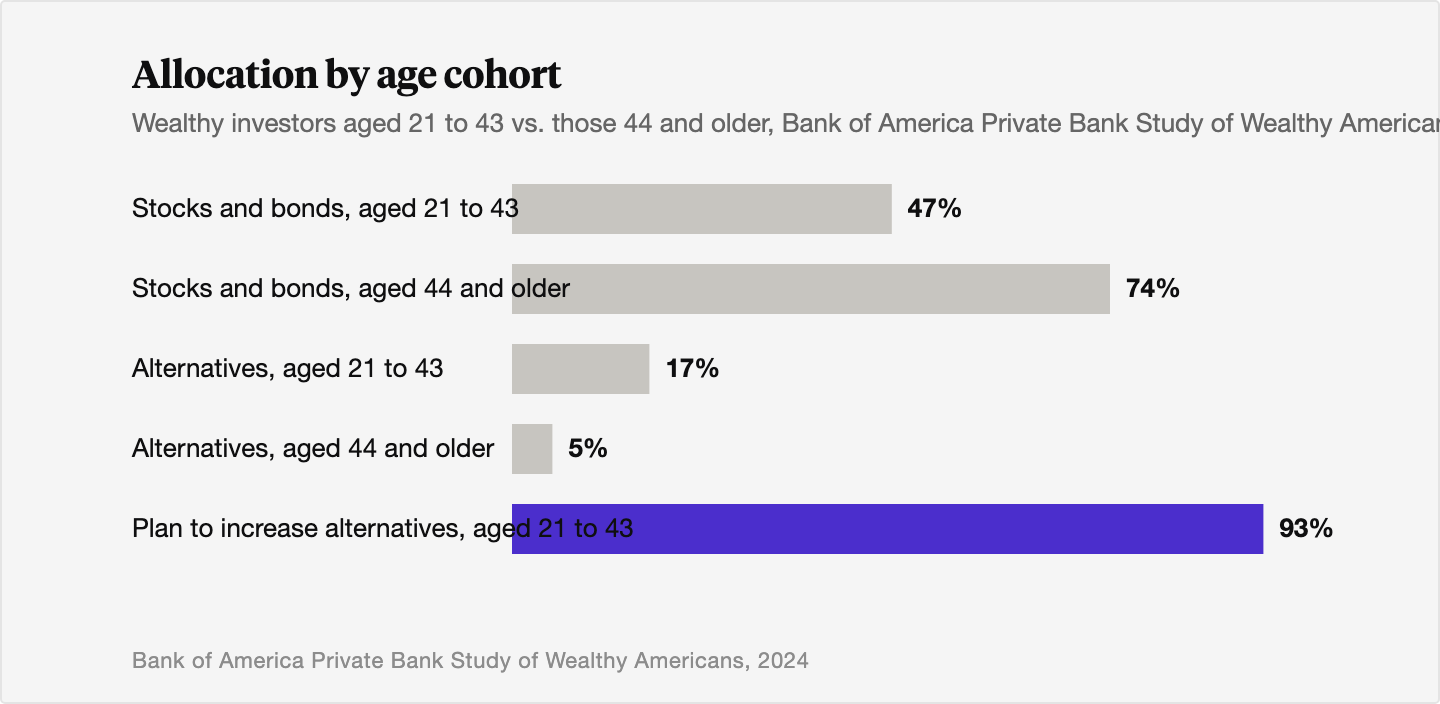
- Heirs allocate differently than their parents. Wealthy investors aged 21 to 43 hold 17% of their portfolios in alternatives, against 5% for those 44 and older, and 93% plan to allocate more [3]. The next owners of this capital have already told surveyors where they intend to put it.
- Advisors face a retention gap. Roughly 41% of U.S. advisors call the transfer an existential threat to their practice, and 47% of inheritors say they will not keep their benefactor's advisor [4]. The relationship that managed the wealth often does not survive the handoff.
- Collectibles and art are inside this conversation. Deloitte estimates nearly $1 trillion in fine art could change hands through the transfer by 2035, about $100 billion a year [5]. We cover the art-demand mechanics in a companion piece and summarize the handoff dynamics near the end here.
1. How big is the great wealth transfer, and over what window?
Start with the number that anchors every other claim. Cerulli Associates, the research firm whose dataset most advisors cite, projects $124 trillion in U.S. wealth changing hands through 2048 [1]. Of that, $105 trillion goes to heirs and $18 trillion to charity. The figure is a revision upward. Cerulli's earlier work put the total at $84.4 trillion through 2045, with $72.6 trillion to heirs and $11.9 trillion to charity [2]. Asset-price growth between the two studies, mostly equities and real estate, accounts for much of the increase.
A note on why the range matters. When you read "$84 trillion" or "$124 trillion," you are reading two vintages of the same Cerulli model, dated to 2045 and 2048 respectively. The original $84 trillion figure is the one that entered the public vocabulary, which is why this piece carries it in the title. The current figure is $124 trillion. We use the original where the phrase is the subject and the current where the dollars are. Neither is wrong. They are snapshots of a moving estimate, and we would hold the precise destination loosely.
The window is the part that gets less attention than the headline. The bulk of the transfer is not a single event. It unfolds across roughly two decades as the Boomer cohort, born 1946 to 1964, moves through its seventies and eighties. Nearly $100 trillion, about 81% of all transfers, comes from Boomer and older households [1]. The Silent Generation moves first, and its share clears the system within the next 10 years or so. That timing tells you the transfer is already underway. It is not a forecast about 2048. It is a description of money in motion right now.
2. Why the transfer is more concentrated than the trillions suggest
The aggregate figure hides a structural fact that matters more than the total. The money is not spread evenly across American families. More than $62 trillion, over half of the projected transfers, comes from households that are already high net worth or ultra high net worth [1]. Those households are about 2% of the U.S. total. In the earlier $84 trillion study, the equivalent figure was $35.8 trillion, 42% of the total, from the 1.5% of households in those tiers [2].
We tend to think about high-end markets, art among them, as a call option on the top 1%, really the top 0.01%. The reason is simple. A serious collection or a meaningful alternatives sleeve runs into the millions, and only the very wealthy can fund it at scale. So when the dollars concentrated at the very top change ownership, the asset classes those households favor are on the receiving end of the handoff whether they court it or not.
Concentration also shapes the timing within the timing. UHNW estates tend to be more planned, more trust-wrapped, and slower to liquidate than mass-affluent ones. That is partly why so much of the early flow is horizontal. Cerulli projects $54 trillion moving to spouses before it ever reaches the next generation, with nearly $40 trillion of that going to widowed women in the Boomer and older cohorts [1]. The first stop for a large share of this capital is a surviving spouse, often a woman, frequently in her seventies or eighties. The generational handoff most headlines describe is the second leg, not the first.
This is the structural map for anyone thinking about where the money lands. Top-heavy, spouse-first, and slower at the top than the totals imply.
3. Who inherits, and how do their preferences differ?
The recipients are not a monolith. Cerulli's projections show Millennials inheriting the most over the full 25-year horizon, about $46 trillion, while Gen X stands to receive the largest share over the next 10 years, roughly $14 trillion against Millennials' $8 trillion in that nearer window [1]. Gen X is the immediate event. Millennials are the larger eventual one. Gen Z sits further out on the curve.
The more useful question for an investor is behavioral. Do heirs allocate like their parents? The data says no, and the gap is wide. The 2024 Bank of America Private Bank Study of Wealthy Americans, which surveyed investors with at least $3 million in investable assets, found that 72% of those aged 21 to 43 agreed it is no longer possible to achieve above-average returns with only stocks and bonds. Among investors 44 and older, just 28% agreed [3]. That is not a marginal difference in taste. It is a different worldview about where returns come from.
The portfolios already reflect it. The younger cohort held 47% of assets in stocks and bonds, against 74% for the older group. They held 17% in alternatives, against 5%. And 93% said they planned to allocate more to alternatives in the coming years [3]. We would treat self-reported intent with some caution, since plans and behavior diverge. But the direction is consistent across surveys, and the starting allocation is already three times the older cohort's.
Why the shift? Younger wealthy investors came of age through the 2008 crisis, a decade of near-zero rates, and a 2022 in which stocks and bonds fell together. The classic 60/40 portfolio, which assumes the two move in opposition, did not behave as advertised in that year. An investor who watched that happen in their formative earning years is more open to assets that march to their own clock. Real estate, private equity, gold, and collectibles all gain in that frame.
4. The advisor-retention gap, and why it matters for allocation
There is a second handoff happening alongside the first, and it changes where the money goes. When an heir inherits, they frequently change who manages the money, and the new manager often holds a different allocation philosophy.
The numbers are stark. Roughly 41% of U.S. financial advisors describe the wealth transfer as an existential threat to their practice, and 22% report they have already lost significant assets to generational attrition [4]. From the heir's side, 47% of investors expecting an inheritance say they do not plan to keep their parents' or spouse's advisor [4]. Cerulli's own work on inheritors who have already received wealth finds an even lower retention rate, with only about a fifth maintaining the prior advisory relationship [6].
Why this matters for allocation, and not only for the advisory industry. The advisor who built a 70%-equities, low-alternatives portfolio for a Boomer client is frequently not the advisor managing that money five years after it passes. The heir brings their own advisor, or hires a new one, and that relationship starts from the heir's preferences. The 17%-alternatives starting point we saw in section 3 becomes the design brief for a fresh portfolio rather than a tilt on an inherited one. The retention gap is the mechanism that lets the generational preference shift actually reprice portfolios, instead of leaving inherited allocations frozen in place.
The advisors who hold on tend to be the ones who built a relationship with the next generation before the transfer, and who can speak to the asset classes heirs already favor. That last part is the operational reason demand for alternatives advisory is rising even as some firms pull back. We treat the alternatives-allocation question in detail in a companion piece on art as a portfolio allocation art as an alternative allocation, a framework for advisors.
5. What the transfer means for the allocation map
Pull the threads together and a picture forms. A large, concentrated pool of capital is moving to a generation that already allocates more to alternatives, through a handoff that frequently resets the managing relationship and the portfolio design with it. Each of those facts on its own is modest. Stacked, they describe a multi-decade tailwind for asset classes outside public stocks and bonds.
We would be precise about what this does and does not imply. It does not imply that any specific alternative asset will appreciate, and it does not promise a return. Past performance is not predictive, and a structural demand shift can coincide with years of flat or falling prices in any given category. What the transfer does is change the composition of the demand pool. More of tomorrow's wealthy investors start from a higher alternatives allocation and a stated intent to raise it. Whether that intent survives the next downturn is an open question, and one we would not pretend to answer with confidence.
There is also a supply consideration that cuts the other way. Heirs do not only buy. They sell. Inherited estates contain illiquid assets, businesses, real estate, collections, that heirs often liquidate in the first few years to simplify, diversify, or fund their own preferences. That creates selling pressure in some categories at the same time it creates buying interest in others. The map is not uniformly bullish. It is a redistribution, and redistribution has two sides.
For families thinking about the handoff itself, the planning question is separate from the market question. How wealth is structured before it transfers, through trusts and other vehicles, shapes how much of it survives the journey and how it is taxed along the way. We cover the structuring side in companion pieces on how families build and keep generational wealth and the difference between revocable, irrevocable, and dynasty trusts.
6. How the handoff touches collectibles and art
Art and collectibles sit inside the transfer in a specific way, and it is worth a short treatment here rather than a full one, because we cover the art-demand mechanics in depth elsewhere.
The scale is meaningful. Deloitte's Art and Finance work estimates that nearly $1 trillion in fine art could change hands through the great wealth transfer by 2035, roughly $100 billion a year, based on art and collectibles making up about 5% of the wealth in motion [5]. That is a large pool of objects moving from one generation to the next over a defined window.
The behavioral gap shows up here too. The same younger cohort that allocates more to alternatives also engages with tangible assets at high rates. In the Bank of America study, 83% of investors aged 21 to 43 owned or were interested in art, alongside elevated interest in watches, wine, and other collectibles [3]. The appetite is there. The taste, though, is not identical to their parents'. Deloitte reports that about 61% of collectors have not discussed their collection with heirs at all, and its researchers describe a generational shift back toward emotion, culture, and identity as motivators, with younger heirs leaning toward urban and digital work [5].
That gap between what parents collected and what heirs want is the crux. The very first thing we learned building our index is that appreciation in art follows fashion, and fashion moves generationally. So an inherited collection is as likely to be sold or reshaped as it is to be kept intact. An heir who wants to simplify a parent's holdings typically sells first and keeps a few favorites. That is the same two-sided dynamic from section 5, expressed in canvases. It creates selling pressure and buying opportunity in the same market at the same time.
We treat the demand-side detail, which categories gain, who the new buyers are, and how they buy, in a dedicated piece on how the wealth transfer is changing art demand. The point for this piece is narrower. The handoff that moves stocks and trusts also moves collections, and the people on the receiving end have their own ideas about what to hang on the wall.
The Bottom Line
- The great wealth transfer is a real, in-progress movement of capital, estimated by Cerulli at $124 trillion through 2048 after an earlier $84.4 trillion estimate through 2045. Most of it moves within the next 10 to 20 years.
- The dollars are concentrated. Over half come from the roughly 2% of households that are high net worth or ultra high net worth, and a large early share passes horizontally to surviving spouses before reaching the next generation.
- Heirs allocate differently. Wealthy investors aged 21 to 43 hold three times the alternatives allocation of older investors and say they plan to raise it further.
- The handoff frequently resets the advisory relationship, with about 47% of inheritors planning to switch advisors, which lets the generational preference shift actually reprice portfolios rather than leaving inherited allocations frozen.
- The map is a redistribution with two sides. The same transfer that lifts demand for alternatives also produces selling pressure as heirs liquidate inherited illiquid assets, including art collections.
- Past performance is not predictive. A structural demand shift changes the composition of the buyer pool, and it does not guarantee appreciation in any asset class or any single work.
Sources
- Cerulli Associates. "Cerulli Anticipates $124 Trillion in Wealth Will Transfer Through 2048." Cerulli Associates Press Release, December 5, 2024. https://www.cerulli.com/press-releases/cerulli-anticipates-124-trillion-in-wealth-will-transfer-through-2048
- Cerulli Associates. "Cerulli Anticipates $84 Trillion in Wealth Transfers Through 2045." Cerulli Associates Press Release, 2022. https://www.cerulli.com/press-releases/cerulli-anticipates-84-trillion-in-wealth-transfers-through-2045
- Bank of America. "BofA Private Bank Study of Wealthy Americans Finds Generational Divide in Investing, Giving and Preserving Wealth." Bank of America Newsroom, June 18, 2024. https://newsroom.bankofamerica.com/content/newsroom/press-releases/2024/06/bofa-private-bank-study-of-wealthy-americans-finds-generational-.html
- Natixis Investment Managers. "Over 40% of U.S. Financial Advisors See Wealth Transfer as an Existential Threat to Business." Natixis Investment Managers Press Release, April 14, 2026. https://www.im.natixis.com/en-us/about/newsroom/press-releases/2026/financial-advisors-see-wealth-transfer-as-existential-threat
- Healy, Ryan. "Nearly $1 trillion in fine art could change hands during the Great Wealth Transfer." Fortune, November 19, 2025. https://fortune.com/2025/11/19/great-wealth-transfer-art-collections-boomers-millennials-dinosaur-skeletons/
- Frank, Robert. "Few heirs keep their parents' wealth advisors, most wealthy benefactors don't mind." CNBC, October 16, 2025. https://www.cnbc.com/2025/10/16/heirs-parents-wealth-advisor-cerulli-study.html
- UBS. "Global Wealth Report 2025: Wealth growth accelerated in 2024." UBS Global, June 18, 2025. https://www.ubs.com/global/en/media/display-page-ndp/en-20250618-gwr-2025.html
- Fortune. "The $124 trillion Great Wealth Transfer is bigger than ever, and millennials will get the biggest cut." Fortune, July 23, 2025. https://fortune.com/2025/07/23/great-wealth-transfer-124-trillion-bigger-than-ever-millennials-gen-x/
- CNBC. "Young, wealthy investors turn to alternatives instead of traditional stock and bond investments." CNBC, July 5, 2024. https://www.cnbc.com/2024/07/05/young-wealthy-investors-are-turning-to-alternative-investments.html
- Cerulli Associates. "Generation X Represents the Most Immediate Opportunity for Wealth Managers." Cerulli Associates Press Release, 2024. https://www.cerulli.com/press-releases/generation-x-represents-the-most-immediate-opportunity-for-wealth-managers
- Glenmede. "The Great Generational Wealth Transfer." Glenmede Insights, 2025. https://www.glenmede.com/insights-private-wealth/the-great-generational-wealth-transfer/
- UBS. "The Art Basel and UBS Global Art Market Report 2026." UBS Global, 2026. https://www.ubs.com/global/en/our-firm/art/article/global-art-market-report.html
Disclosures
Investing involves risk. Past results are not indicative of future outcomes.
Masterworks is providing this communication as an agent for its issuer entities, not Masterworks Advisers. This material is produced by Masterworks for informational purposes only and does not constitute investment advice, a recommendation, or an offer or solicitation to buy or sell any security. Masterworks is not a licensed broker-dealer by the SEC or FINRA.
Masterworks can only make and accept sales after an offering statement has been filed, and "qualified", by the SEC. Any offers may be revoked before notice of qualification. Indications of interest involve no obligation. For further disclosure visit the offering documents filed with the SEC and Important Disclosures at masterworks.com/cd.
Forward-looking statements and internal estimates are based on assumptions that may prove incorrect, and actual outcomes may differ materially. Figures denoted in brackets are subject to confirmation. Investing in art and alternative assets involves risk, including loss of principal.
Art sales price data is comparative only. Each painting is unique and historical data is not a direct proxy for any specific painting or investment. Data represents whole art, not an investment into our offerings which includes fees and expenses. Any comparative images are not currently live offerings and are provided for educational purposes only.
Masterworks, LLC is located at 1 World Trade Center, 57th Floor, New York, NY 10007.


