
Masterworks Research · June 2026
Why the objective changes once a portfolio is large, what actually threatens it, and the tools that protect purchasing power without surrendering all of the upside.
Wealth preservation is the discipline of protecting a large portfolio's real purchasing power and surviving deep drawdowns, rather than maximizing its rate of growth. The reason the goal changes is arithmetic. When you already have enough, a large loss costs you more than an equally large gain ever earns back, so avoiding the loss is worth more than chasing the next point of return. In our view the shift is less about getting more cautious and more about respecting two forces that compound against a big portfolio over time: the math of recovery after a drawdown, and the slow erosion of money by inflation. This piece lays out the real threats, the tools that address them, the trade-off between defense and long-run return, and the behavioral discipline the whole exercise requires.
What You Need to Know
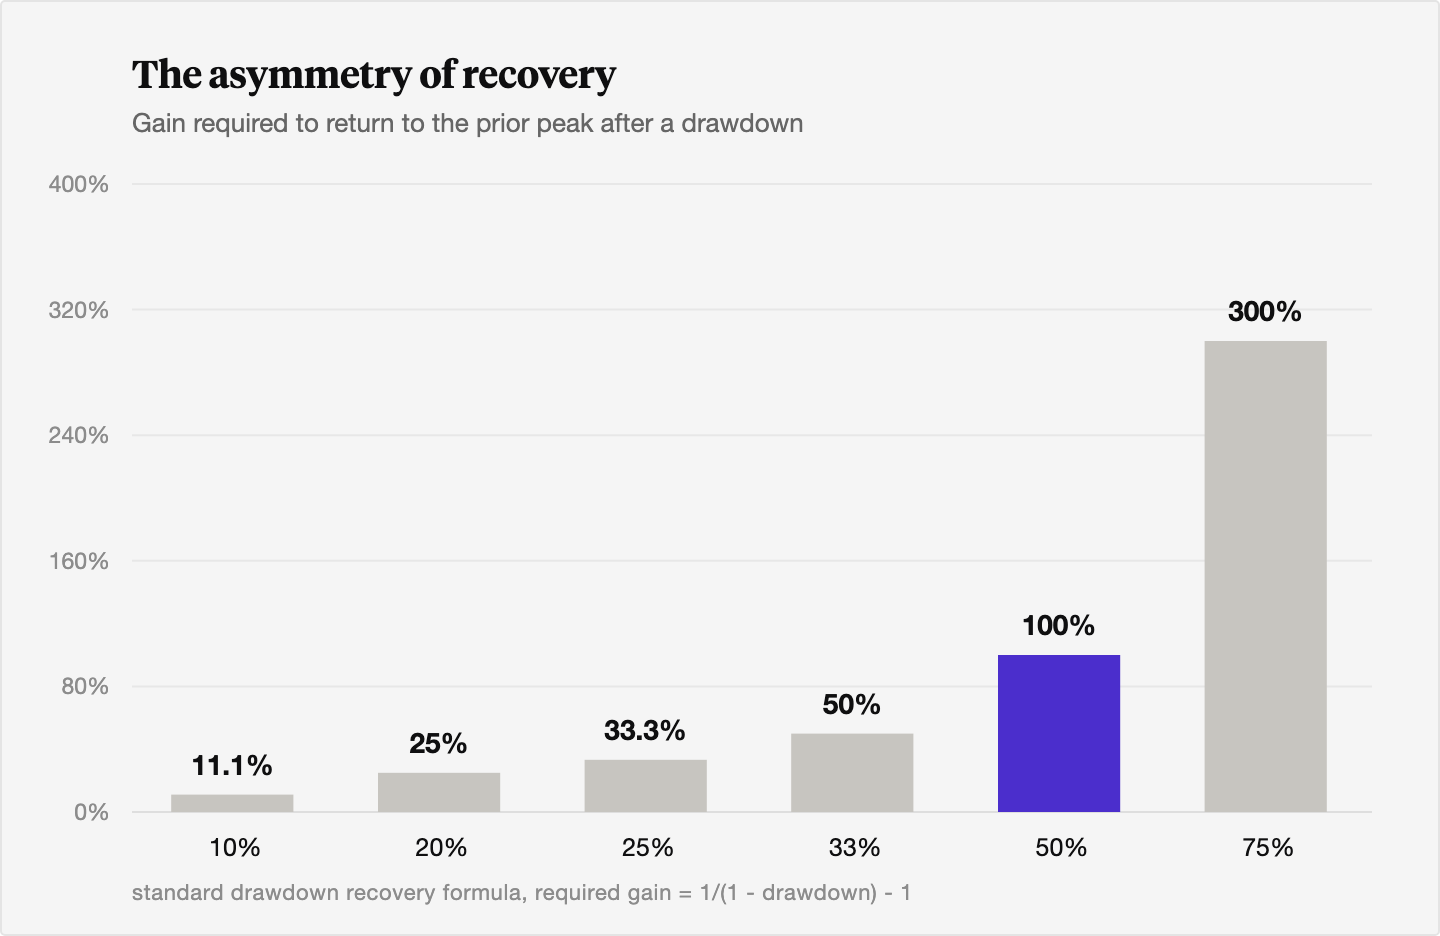
- The math of recovery is asymmetric, and it gets worse with size. A 10% loss needs an 11.1% gain to get back to even, a 25% loss needs 33.3%, and a 50% loss needs a 100% gain.[1] Preventing large drawdowns is mathematically more valuable than recovering from them.
- Inflation is the quiet threat that never stops compounding. The US dollar has lost more than 96% of its purchasing power since 1913, and even the calm years bite: a dollar in 2000 buys about what 53 cents bought then, after 87.1% cumulative inflation through 2025.[2][3]
- Diversification can fail exactly when you need it. In 2022, US stocks and bonds fell together for the first time since 1969, and a standard 60/40 portfolio posted its worst year since 1937, down roughly 17.5%.[4][5] Preservation calls for sources of return that answer to different forces.
- Concentration is a hidden drawdown risk. Over the long run most individual stocks underperform Treasury bills, and a tiny share of names account for nearly all net wealth creation.[6] A portfolio built on a few winners is one exit away from a large, permanent loss.
- The standard answer for large portfolios is a small sleeve of uncorrelated real assets. Ultra-high-net-worth collectors hold an average of 10.4% of total wealth in art and collectibles, and 87% of wealth managers now want art handled inside the broader wealth plan.[7] Blue-chip art is one such low-correlation holding, held at a small weight.
1. Why the objective changes once a portfolio is large
Early in building wealth, the order of returns barely matters. A 20% loss followed by a 25% gain leaves you roughly where a 25% gain followed by a 20% loss would, because you are adding to the pile and not drawing it down. The compounding works in your favor and time is on your side.
A large portfolio that has to fund a life, a family, and a legacy is a different problem. Now the portfolio is the income source, and withdrawals during a downturn lock in losses that can never be recovered. The objective quietly flips from "how much can this grow" to "how much can this lose and still do its job."
Here is the part that surprises people. Once you have enough, the marginal dollar of gain matters less than the marginal dollar of loss, because the loss threatens the plan and the gain only pads it. That is the whole logic of playing defense. You are managing to a floor, not a ceiling.
2. The math of recovery, and why drawdowns are the enemy
Start with the arithmetic, because it drives everything else. The gain required to recover from a loss is always larger than the loss itself, and the gap widens fast. The formula is simple: required gain equals 1 divided by (1 minus the drawdown), minus 1.[1]
A 10% loss requires an 11.1% gain to get back to even. A 25% loss requires 33.3%. A 50% loss requires a 100% gain, a full double, just to return to where you started.[1] The deeper the hole, the more exponential the climb out of it.
Time compounds the damage. After the dot-com peak in March 2000, the S&P 500 fell about 49% by October 2002 and did not reclaim its prior high until 2007, roughly seven years later.[8] An investor drawing income across those seven years was selling shares into the hole, which is the bridge to the next threat.
The verdict is the one professional risk managers reach: it is worth more to avoid a deep drawdown than to be brilliant at recovering from one.
3. Sequence of returns risk: when the order of losses decides everything
Sequence of returns risk is the danger that poor returns early in the withdrawal phase, paired with ongoing spending, permanently impair a portfolio even if the average return over time looks fine.[9] Two portfolios can earn the identical average return and end in completely different places, depending only on when the bad years arrive.
The cleanest illustration we have seen comes from a US Bank study. Two investors each start with $1,000,000 and withdraw $45,000 a year, rising 3% annually for inflation. They face the exact same set of returns, just in opposite order. The investor who hits good years first funds 40 years of income. The investor who hits a 15% down year at the very start runs out of money after about 25 years.[10] Same average return. A 15-year difference in how long the money lasts.
The mechanism is the one from Section 2. Selling assets while they are down means selling more shares to raise the same cash, leaving fewer shares to participate in the recovery. For anyone drawing on a large portfolio, the first decade is the fragile one, when the balance is largest and a bad sequence does the most permanent harm.[9]
4. Inflation and currency debasement: the threat that never sleeps
A portfolio can be flat in dollars and still be losing. Inflation is the erosion of purchasing power, and over long horizons it is the most reliable adversary a large portfolio faces, because it never takes a year off.
The long record is stark. The US dollar has lost more than 96% of its purchasing power since 1913, by Bureau of Labor Statistics consumer price data.[2] You do not need a hyperinflation to feel it. From 2000 to 2025, cumulative US inflation ran 87.1%, an average of 2.54% a year, so $100 in 2000 buys what about $187 buys today, meaning that 2000 dollar now holds roughly 53 cents of its old purchasing power.[3] The recent burst was sharper still: from 2020 to 2025 prices rose about 24.5%, stripping nearly a fifth of the dollar's value in five years, with headline inflation peaking at 9.1% in June 2022, the highest reading since 1981.[3][11]
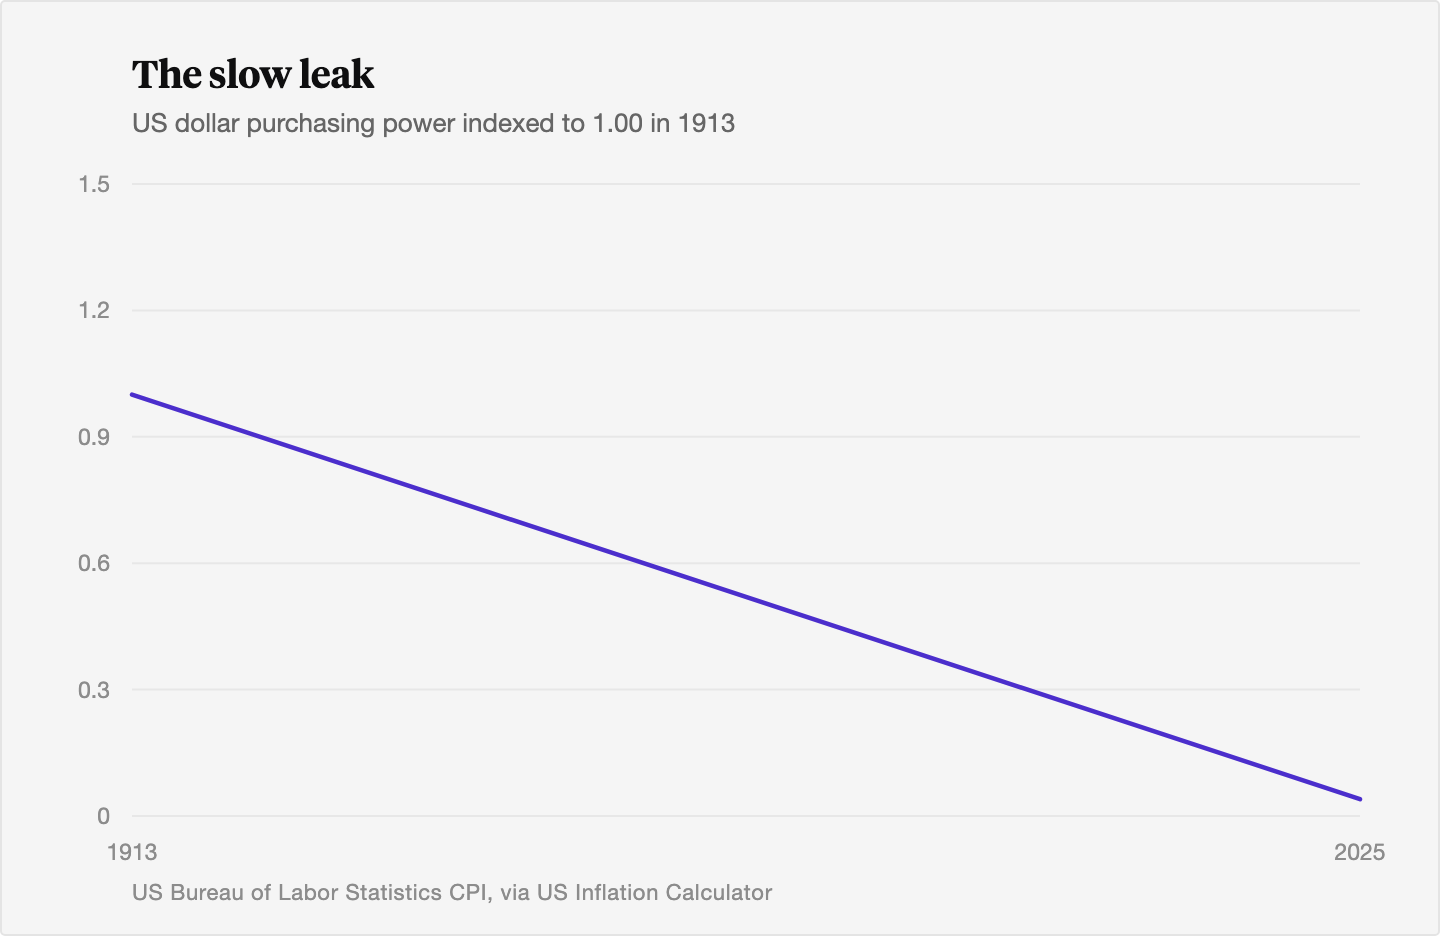
The cruelty is the compounding. A 3% annual loss feels harmless in any one year. Compounded across a 30-year horizon it cuts purchasing power roughly in half. For a large portfolio meant to last decades or pass between generations, the cash that feels safe is quietly the riskiest holding of all.
5. Concentration risk: the drawdown hiding in plain sight
Most large fortunes were built through concentration, a founder's stock, a single business, one outsized winner. The same concentration that builds wealth is one of the most dangerous things to keep once the wealth is large, because a single bad outcome can erase decades of work and cannot be diversified away after the fact.
The data on single-name risk is sobering. In Hendrik Bessembinder's research, 55.2% of US common stocks delivered lifetime returns below one-month Treasury bills, and roughly 4% of listed firms account for essentially all the net wealth the entire US stock market created since 1926.[6] The market's gains are produced by a thin sliver of names, which means a portfolio resting on a few positions is far likelier to hold a laggard than a legend.
Translated into preservation terms, concentration is an undiagnosed drawdown waiting to happen. The fix is unglamorous: spread the risk across many holdings and across asset classes that do not all answer to the same forces, so that no single failure can take down the plan.
6. The diversification problem, and what actually counts as a diversifier
Diversification is the standard defense, and in 2022 it failed in the way that matters most. US stocks and bonds fell together for the first time since 1969, and a 60/40 portfolio recorded its worst year since 1937, down about 17.5%.[4][5] The hedge that is supposed to cushion equity losses, high-quality bonds, dropped alongside stocks because the same force, rising rates to fight inflation, drove both.
That episode clarifies what real diversification means. True diversification is owning something largely indifferent to the forces driving everything else. An asset that simply rises whenever stocks fall is a lucky hedge, and lucky hedges tend to stop working at the worst time. What preserves capital is a return source on its own clock.
This is the case for genuinely uncorrelated holdings: assets whose prices respond to different inputs than equities and bonds. Their value in a portfolio is not that they outrun stocks. It is that they keep paying their own way when the correlated core is having a bad year, which softens the drawdown and protects the sequence.
7. The toolkit for playing defense
Preservation is built from a handful of tools, each addressing one of the threats above. None is exotic. The discipline is in combining them and holding the line.
Diversification across uncorrelated assets. Spread risk so no single factor, recession, rate shock, or one company's fate, can take down the plan. The aim is a set of return streams that do not move in lockstep.
Quality fixed income. High-grade bonds still provide predictable income and ballast, and after the 2022 reset they offer real yields that can help offset inflation. The lesson of 2022 is to size the allocation knowing bonds and stocks can fall together.
Liquidity laddering. Hold enough in cash and short-dated, high-quality instruments to fund several years of spending without selling growth assets into a downturn. This is the direct antidote to sequence risk, because it lets the portfolio recover before you have to touch it.
Real and hard assets. Real estate, infrastructure, commodities, gold, and a small sleeve of scarce real assets are meant to hold value when paper money loses it, addressing the inflation threat the cash pile cannot.
Tax efficiency. Taxes are a recurring drawdown you control. Asset location, harvesting losses, and avoiding forced sales all reduce the leakage that compounds against a large portfolio over decades.
The thread connecting them is purchasing power. Each tool is there to keep the real value of the portfolio intact through a cycle, not to win any single year.
8. The trade-off: what defense costs in long-run return
Playing defense is not free, and pretending otherwise would be dishonest. Capital that sits in cash and high-grade bonds to buffer drawdowns is capital not compounding in higher-returning assets, so a more defensive portfolio will usually trail an aggressive one over a long bull market. That is the price of the floor.
The reason large portfolios pay it comes back to Section 1. When you already have enough, the downside of a deep loss outweighs the upside of the extra return you gave up, because the loss can break the plan and the extra return only enlarges a pile you did not need to grow. Past performance is not predictive, and no allocation guarantees an outcome, so the honest framing is a deliberate exchange: you accept a lower expected return in return for a narrower range of outcomes and a higher floor.
The goal is not to eliminate risk, which is impossible, but to take only the risks that are paid for and to refuse the ones that threaten the whole. That is what separates preservation from simple caution.
9. The behavioral discipline preservation requires
The hardest part of preservation is not the math. It is sitting still. The same instincts that feel like prudence, selling into a panic, chasing a hot asset, abandoning a plan after a bad year, are exactly the behaviors that turn a temporary drawdown into a permanent loss.
Selling in a downturn is the cardinal error, because it converts a paper loss into a realized one and forfeits the recovery that history shows tends to follow. The investors who hold through a drawdown, or better, buy near the bottom, capture the rebound. Those who sell lock in the worst price.
Discipline means writing the plan in advance, sizing each position so no single move forces a reaction, and holding enough liquidity that you are never a forced seller. The floor is what lets you stay rational. When you know the plan survives a bad year, you can ignore the noise that costs other investors so much.
10. Where blue-chip art fits, honestly
Here is the honest art-relevance bridge. Wealth preservation often includes a small sleeve of scarce real assets that do not move in lockstep with public equities, and blue-chip art is one such low-correlation, inflation-aware holding that some large portfolios use at a modest weight. The institutional behavior bears this out: ultra-high-net-worth collectors hold an average of 10.4% of total wealth in art and collectibles, and 87% of wealth managers now cite the need to handle art inside the broader wealth plan.[7] Major wealth managers describe investment-grade art as having low correlation to other major asset classes.[12]
We want to be precise about what that does and does not mean. Art's value in a preservation context is correlation, not protection. Blue-chip art has historically responded to different forces than equities and bonds, mainly wealth creation at the very top, which is why it can keep its own clock when the correlated core is down. That low correlation is what makes a small allocation useful at the margin.
Now the limits, stated plainly. Art is illiquid and can take months or years to sell. It yields nothing while you hold it, generates no dividend or coupon, and carries storage, insurance, and transaction costs. It is volatile at the individual-work level and has its own multi-year drawdowns. It is a diversifier held at a small weight, and it is not a substitute for the liquidity ladder or the quality bonds that do the real work of capital protection. Anyone reaching for art as a safe haven has misread the job. It belongs in the uncorrelated sleeve, sized small, alongside the other real assets, and nowhere near the cash you may need next year.
The Bottom Line
- Once a portfolio is large, the objective shifts from maximizing growth to protecting real purchasing power and surviving drawdowns, because a large loss costs more than an equal gain earns back.
- The math is unforgiving: a 50% loss needs a 100% gain to recover, so avoiding deep drawdowns is worth more than recovering from them.
- Inflation is the threat that never stops, having taken more than 96% of the dollar's purchasing power since 1913 and nearly a fifth in the five years through 2025.
- Sequence of returns risk means the order of losses can decide whether a portfolio lasts 40 years or 25, which is why liquidity laddering matters for anyone drawing income.
- The defensive toolkit is diversification across uncorrelated assets, quality fixed income, liquidity laddering, real and hard assets, and tax efficiency, accepting a lower expected return for a higher floor.
- Blue-chip art is one low-correlation real asset some large portfolios hold at a small weight, useful as a diversifier but illiquid, yield-free, and no replacement for liquidity or quality bonds.
Sources
- TradeZella. "Drawdown Recovery: The Math Behind Getting Back to Even." 2025. https://www.tradezella.com/blog/drawdown-recovery
- Macrotrends. "CPI: Purchasing Power of the Dollar (1913 to 2026)." 2026. https://www.macrotrends.net/4534/cpi-purchasing-power-of-the-dollar
- Official Data Foundation (in2013dollars). "Inflation Rate between 2000 and 2025: $100 in 2000 equals $187.10 in 2025." 2026. https://www.in2013dollars.com/us/inflation/2000?amount=100&endYear=2025
- The Motley Fool. "2022 Was the Worst Year Since 1937 for the 60/40 Investing Strategy." January 2023. https://www.fool.com/investing/2023/01/26/2022-was-the-worst-year-since-1937-for-this-invest/
- CAIA Association. "The 60/40's Annus Horribilis." February 2023. https://caia.org/blog/2023/02/04/6040s-annus-horribilis
- SSRN (Hendrik Bessembinder et al.). "Long-Term Shareholder Returns: Evidence from 64,000 Global Stocks." 2025. https://papers.ssrn.com/sol3/papers.cfm?abstract_id=3710251
- ArtTactic. "Deloitte and ArtTactic Art and Finance Report 2025." 2025. https://arttactic.com/reports/deloitte-and-arttactic-or-art-and-finance-report-2025
- Rockefeller Capital Management. "The History of Bull and Bear Markets." 2025. https://www.rockco.com/strategic-insights/bull-and-bear-markets/
- Thrivent. "What Is Sequence of Returns Risk and How Does It Impact Retirement." 2025. https://www.thrivent.com/insights/investing/sequence-of-returns-risk-what-it-means-for-your-retirement
- U.S. Bank. "Sequence of Returns Risk and Impact on When to Retire." 2025. https://www.usbank.com/retirement-planning/financial-perspectives/sequence-of-returns-risk-impact-when-to-retire.html
- U.S. Bureau of Labor Statistics. "Consumer Prices Up 9.1 Percent Over the Year Ended June 2022, Largest Increase in 40 Years." July 2022. https://www.bls.gov/opub/ted/2022/consumer-prices-up-9-1-percent-over-the-year-ended-june-2022-largest-increase-in-40-years.htm
- Morgan Stanley. "Art as an Investment Class." 2025. https://www.morganstanley.com/articles/art-collection-wealth-management
- KKR. "Capital Preservation Portfolio." 2026. https://www.kkr.com/wealth/model-portfolios/capital-preservation-portfolio
- CFA Institute Enterprising Investor. "Capital Preservation Wealth." 2026. https://rpc.cfainstitute.org/blogs/enterprising-investor/2026/capital-preservation-wealth
Related Reading
- What are real assets: real estate, infrastructure, and commodities
- Art vs gold as a hedge asset: performance, correlation, and trade-offs
- Art's impact on portfolio drawdowns: what the data shows
- Hard assets vs financial assets: the case for owning real things
Disclosures
Investing involves risk. Past results are not indicative of future outcomes.
Masterworks is providing this communication as an agent for its issuer entities, not Masterworks Advisers. This material is produced by Masterworks for informational purposes only and does not constitute investment advice, a recommendation, or an offer or solicitation to buy or sell any security. Masterworks is not a licensed broker-dealer by the SEC or FINRA.
Masterworks can only make and accept sales after an offering statement has been filed, and "qualified", by the SEC. Any offers may be revoked before notice of qualification. Indications of interest involve no obligation. For further disclosure visit the offering documents filed with the SEC and Important Disclosures at masterworks.com/cd.
Forward-looking statements and internal estimates are based on assumptions that may prove incorrect, and actual outcomes may differ materially. Figures denoted in brackets are subject to confirmation. Investing in art and alternative assets involves risk, including loss of principal.
Art sales price data is comparative only. Each painting is unique and historical data is not a direct proxy for any specific painting or investment. Data represents whole art, not an investment into our offerings which includes fees and expenses. Any comparative images are not currently live offerings and are provided for educational purposes only.
Masterworks, LLC is located at 1 World Trade Center, 57th Floor, New York, NY 10007.


