
Masterworks Research · June 2026
How the wealth-management industry draws the lines between mass affluent, HNW, VHNW, and UHNW, why those lines are drawn on investable assets rather than total net worth, and what changes at each tier.
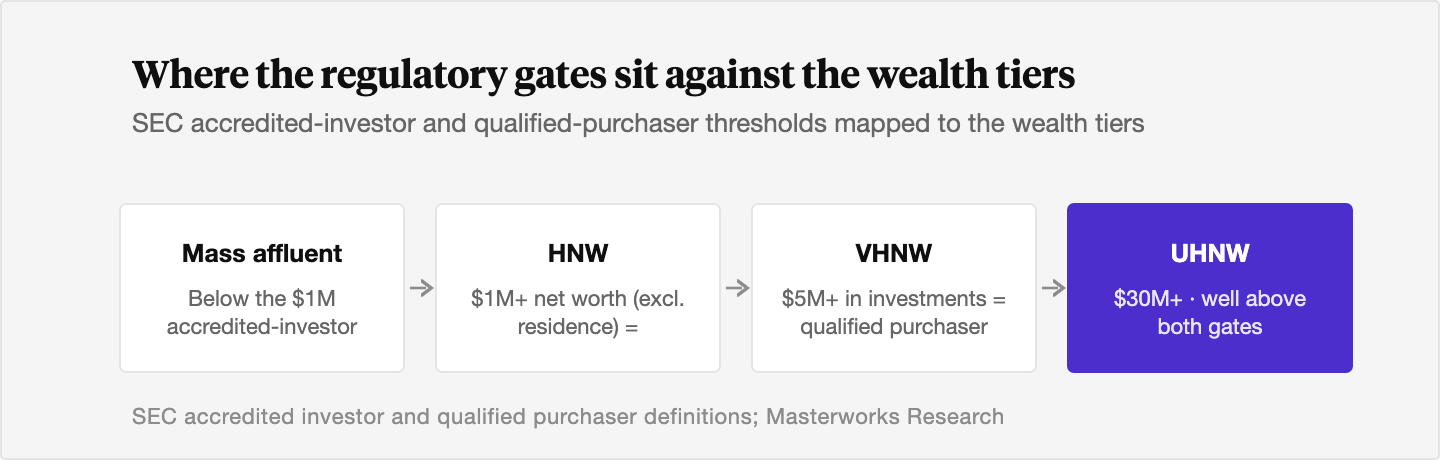
In wealth management, "high net worth" usually means an individual with at least $1 million in investable assets, not counting the home they live in. The industry then splits the wealthy into tiers: mass affluent below $1 million, high net worth (HNW) at $1 million and up, very high net worth (VHNW) commonly in the $5 million to $30 million range, and ultra high net worth (UHNW) at roughly $30 million and above. The exact cutoffs vary by firm and by report, because these are commercial segmentation labels rather than legal definitions. The reason the lines matter to an investor is practical: the tier you sit in determines what you can buy, who will serve you, and what a portfolio at that level tends to hold.
What You Need to Know
- The number that defines the tiers is investable assets, not total net worth. Capgemini's World Wealth Report counts someone as high net worth at $1 million in investable assets, explicitly excluding the primary residence, collectibles, and consumer durables [1]. Two people with the same $4 million net worth can land in different tiers depending on how much sits in a house versus a portfolio.
- The population thins quickly as you move up. Capgemini counted about 23.4 million HNW individuals globally in 2024, of whom roughly 21 million held $1 million to $5 million, about 2.2 million held $5 million to $30 million, and only about 234,000 sat above $30 million in the ultra tier [1]. The top tier is 1% of the HNW population and holds 34% of HNW wealth [1].
- The SEC thresholds are related but legally distinct. An accredited investor needs a $1 million net worth excluding the primary residence, or $200,000 in income ($300,000 with a spouse); a qualified purchaser needs $5 million in investments [2][3]. These are regulatory gates for what you can buy, not marketing tiers.
- The service model changes at each step. A mass-affluent saver gets a branch advisor or a robo platform. HNW and VHNW clients get private banking and dedicated wealth management. Above roughly $100 million, a single-family office becomes cost-effective; below that, families share one through a multi-family office [4].
- Portfolios shift toward alternatives as wealth rises. HNW investors held about 15% of their portfolios in alternative investments as of early 2025, and ultra high net worth collectors devote an average of 10.4% of total wealth to art and other collectibles [1][5]. Fine art shows up far more often at the VHNW and UHNW levels than below them.
1. The full ladder: mass affluent, HNW, VHNW, UHNW
The wealth-management industry sorts households into four broad bands. Think of it as a ladder where each rung is defined by how much money is available to invest.
The bottom rung is mass affluent: households with roughly $100,000 to $1 million in investable assets. This is a large group. Spectrem Group has estimated there are around 33 million mass-affluent households in the United States [6]. They are wealthier than the typical household but sit below the line where a bank assigns a dedicated private banker.
The next rung is high net worth (HNW), the $1 million-plus mark that gives the whole category its name. Above that, firms slice the wealthy more finely. Very high net worth (VHNW) is commonly used for the $5 million to $30 million range. Ultra high net worth (UHNW) typically begins at $30 million, the threshold both Capgemini and UBS use for their ultra tier [1][7].
Capgemini's own labels are worth knowing because its World Wealth Report is one of the most-cited sources in the industry. It calls the $1 million to $5 million group "Millionaires Next Door," the $5 million to $30 million group "Mid-Tier Millionaires," and the $30 million-plus group "Ultra-HNWIs" [1]. Different report, slightly different names, same underlying math.
A point worth being precise about: these are not standardized. A private bank might set its VHNW line at $10 million; a wealth report might use $5 million. We use the common ranges here, but the tier is a guide, not a law.
2. Why the line is drawn on investable assets, not net worth
The single most common confusion about these tiers is the difference between net worth and investable assets. They are not the same number, and the gap can be large.
Net worth is everything you own minus everything you owe: house, cars, retirement accounts, business equity, art on the wall, minus mortgages and other debt. Investable assets are the slice of that you can actually deploy into markets. Cash, brokerage accounts, stocks, bonds, fund interests. The wealth industry segments on investable assets because those are the assets a wealth manager can manage and earn a fee on.
Capgemini's definition is explicit. A high net worth individual has $1 million or more in investable assets, "excluding their primary residence, collectibles, consumables, and consumer durables" [1]. The house is out. The car is out. The wine cellar is out.
Imagine two people. One owns a $3 million home outright and has $200,000 in a brokerage account. The other rents and has $1.5 million in a diversified portfolio. On total net worth the first person looks wealthier. On investable assets the second is high net worth and the first is not. The reason the primary residence is usually excluded is that you live in it. You cannot easily spend it, you cannot rebalance it, and selling it means finding somewhere else to live. For the purpose of "what can this person put to work," the home does not count.
That is the whole reason the distinction exists. The tier is meant to measure capital that can be invested, so it strips out the capital that is locked up in daily life.
3. How big is each tier? The population by the numbers
The tiers are not just labels. They describe a population that narrows sharply as wealth climbs.
The clearest recent snapshot comes from Capgemini's World Wealth Report 2025, which counted the world's HNW population at 23.4 million individuals holding $90.5 trillion in wealth as of the end of 2024 [1]. Inside that figure, the distribution is steep:
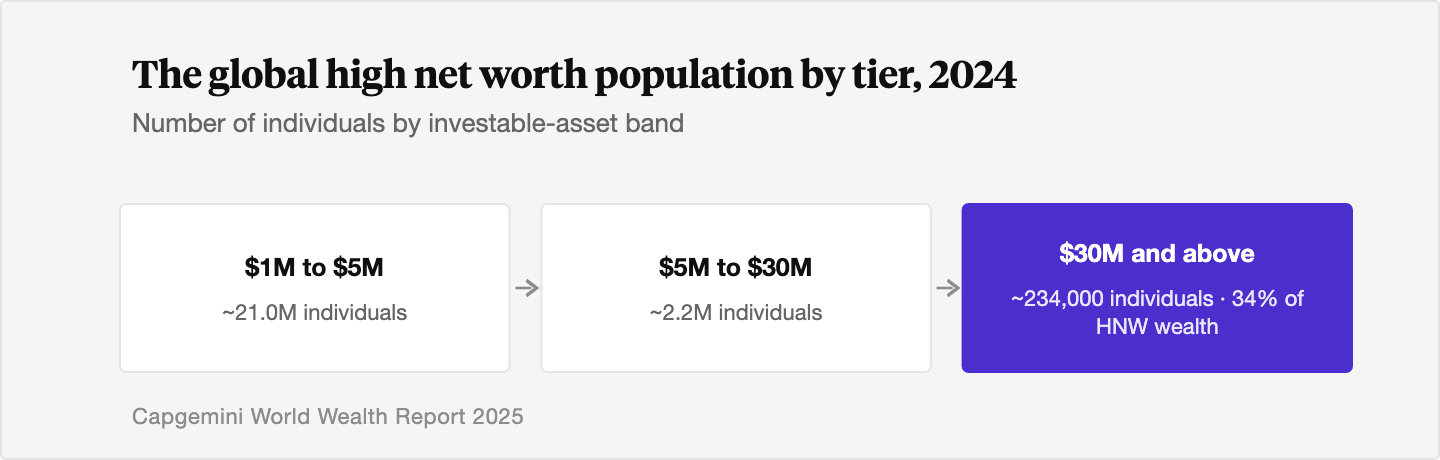
About 21 million people, the large majority of the HNW population, hold between $1 million and $5 million [1]. Roughly 2.2 million sit in the $5 million to $30 million VHNW range. Only about 234,000 individuals worldwide cross into the UHNW tier above $30 million, and that small group controls 34% of all HNW wealth [1]. The wealth concentrates as the headcount thins. That pattern, a narrow top holding a wide share, is the same dynamic that drives the high end of the art market, a point we return to at the end.
A second institutional source frames the entry tier. UBS, in its Global Wealth Report 2025, counted roughly 60 million adults worldwide holding more than $1 million, with the United States home to almost 40% of the world's dollar millionaires [7]. UBS uses total net worth rather than investable assets, which is part of why its millionaire count runs higher than Capgemini's investable-asset count. The methodologies differ, so the headline numbers differ. Both point the same direction: a few tens of millions of millionaires, a few hundred thousand at the very top.
4. The SEC thresholds: accredited investor and qualified purchaser
Here is where the marketing tiers meet the law. The HNW labels are commercial. The thresholds that decide what you are legally allowed to invest in are set by the Securities and Exchange Commission, and they are different numbers serving a different purpose.
An accredited investor, for a natural person, is someone with a net worth over $1 million, excluding the value of the primary residence, or income exceeding $200,000 in each of the prior two years ($300,000 together with a spouse), with a reasonable expectation of the same in the current year [2]. Clearing the accredited bar is what lets you buy into most private offerings, including many private funds and certain alternative-asset products.
A qualified purchaser sits a tier higher. The standard is at least $5 million in investments [3]. The qualified-purchaser bar opens the door to certain large private funds that rely on a different exemption and can take an unlimited number of qualified-purchaser clients.
Notice the design. The accredited net-worth test, $1 million excluding the home, lines up almost exactly with the entry to the HNW tier. That is not a coincidence. Both rest on the same idea: an investor with $1 million in investable wealth is presumed able to bear the risk and absorb the loss of a private, illiquid, less-regulated investment. The qualified-purchaser line at $5 million in investments tracks roughly to where the VHNW tier begins.
To be clear, these are gates, not guarantees. Meeting the accredited definition gives you access. It does not mean a given private investment is suitable for you. The thresholds measure capacity to take risk, not whether you should.
For a fuller treatment of these two standards, see our explainers on what an accredited investor is and why the rules exist and on the higher qualified-purchaser bar.
5. How the service model changes at each tier
The most concrete way the tiers matter is in who serves you and how. Move up the ladder and the relationship changes shape at each step.
At the mass-affluent level, a household typically works with a retail bank advisor, a regional brokerage, or a low-cost digital platform. The service is largely standardized: model portfolios, off-the-shelf funds, scheduled check-ins.
At the HNW and VHNW levels, the relationship becomes personal. This is the home turf of private banking and dedicated wealth management. A private bank assigns a relationship manager, opens access to private investments, and bundles in lending, trust, and tax coordination. The pitch is a single point of contact who quarterbacks a team. We cover the distinction between these two service models in private banking versus wealth management, and the broader picture of building a plan at this level in financial planning for high net worth individuals.
At the UHNW level the family often builds, or buys into, its own institution: the family office. The economics are clean. A dedicated single-family office costs on the order of $1 million to $2 million a year to run, which only makes sense once wealth crosses roughly $100 million to $250 million [4]. Below that, families share the overhead through a multi-family office, which delivers investment, tax, estate, and governance services to several families at once, typically for 0.5% to 1.0% of assets under management plus retainers [4]. For the mechanics of that model, see what a family office is, in plain English.
The through-line is simple. More wealth buys more customization, more access to private markets, and more of a dedicated team. The tier is shorthand for which of those a household can support.
6. What portfolios look like as you climb
The composition of a portfolio shifts as investable wealth rises, and the shift is measurable.
Capgemini's 2025 reading of HNW asset allocation as of January 2025 put cash and cash equivalents at 26%, real estate at 22%, fixed income at 19%, equities at 18%, and alternative investments at 15% [1]. That 15% in alternatives is the line to watch. Alternatives, the category that holds private equity, hedge funds, private credit, and tangible assets, expands as you move up the tiers, because the higher tiers clear the accredited and qualified-purchaser bars that gate most of those products in the first place.
The appetite is generational as well as financial. Capgemini found that 61% of millennial and Gen Z HNW investors are willing to take more risk in pursuit of growth, and that 88% of advisors see greater interest in alternative assets among the next generation than among baby boomers [1]. As the great wealth transfer hands assets to younger holders, the alternatives share is more likely to rise than fall.
This is the bridge to why these tiers matter for the art market, which we take up next.
7. Where fine art fits as wealth rises
As investable wealth climbs through these tiers, portfolios reach further into alternatives and tangible assets, and fine art is one of the assets that shows up more often near the top.
The pattern is visible in the data. Deloitte's Art & Finance Report 2025 estimated that ultra high net worth collectors devote an average of 10.4% of their total wealth to art and other collectibles, and that the value of art and collectibles held by the wealthy rose from about $2.17 trillion in 2022 to about $2.56 trillion in 2024 [5]. The Art Basel and UBS survey of global collecting found high net worth collectors allocating an average of 20% of their wealth to art in 2025, with the share rising among the very wealthiest and longest-tenured collectors [8]. Art is far more present in VHNW and UHNW portfolios than in mass-affluent ones.
The reason is structural, and it traces back to the population funnel in section 3. The high end of the art market runs on wealth creation at the very top. A serious collection costs tens of millions of dollars, so the buyers who set prices for blue-chip works sit in the same narrow UHNW tier that holds 34% of HNW wealth [1]. As that tier grows, demand for a fixed supply of masterworks grows with it. We think this is one of the more durable demand stories in the art market, and we have written about how concentration at the top lifts prices in why wealth concentration lifts the art market.
A small allocation to art is one expression of the broader move into alternatives that happens as households climb the tiers. It is not the only one, and it is not for everyone. Art is illiquid, it carries holding costs, and historical price data is not a promise about any individual work. Past performance is not predictive of future results. The honest framing is that art appears more often at the higher tiers because those investors have both the access and the appetite for it, and a modest position is one of several ways that appetite gets expressed.
The Bottom Line
- The wealth-management tiers, mass affluent, HNW, VHNW, and UHNW, are defined on investable assets, with the primary residence excluded, because the tier is meant to measure capital that can actually be invested.
- The common cutoffs are roughly $100,000 to $1 million for mass affluent, $1 million-plus for HNW, $5 million to $30 million for VHNW, and $30 million-plus for UHNW, though firms vary and the labels are commercial rather than legal.
- The population narrows fast. Capgemini counted about 23.4 million HNW individuals worldwide in 2024, with only about 234,000 above $30 million, and that ultra tier controls roughly a third of all HNW wealth.
- The SEC's accredited-investor ($1 million net worth excluding the home, or $200,000 income) and qualified-purchaser ($5 million in investments) thresholds line up with the entry to the HNW and VHNW tiers, and they decide what you can legally buy.
- The service model scales with the tier, from a branch advisor to private banking to a multi-family or single-family office, and portfolios tilt further toward alternatives, including fine art, as investable wealth rises.
Sources
- Capgemini. "World Wealth Report 2025." Capgemini Research Institute, June 2025. https://www.capgemini.com/insights/research-library/world-wealth-report/
- U.S. Securities and Exchange Commission. "Accredited Investors, Updated Investor Bulletin." Investor.gov, accessed June 2026. https://www.investor.gov/introduction-investing/general-resources/news-alerts/alerts-bulletins/investor-bulletins/updated-3
- U.S. Securities and Exchange Commission. "Review of the Accredited Investor Definition under the Dodd-Frank Act." SEC, December 2023. https://www.sec.gov/files/review-definition-accredited-investor-2023.pdf
- AssetVantage. "Multi-Family Office Minimum Net Worth Explained: When Families Should Consider the Model." AssetVantage, 2025. https://www.assetvantage.com/blogs/multi-family-office-minimum-net-worth/
- Deloitte and ArtTactic. "Art and Finance Report 2025." Deloitte Luxembourg, November 2025. https://www.deloitte.com/lu/en/services/consulting-financial/research/art-finance-report.html
- SmartAsset. "What Does It Mean to Be Mass Affluent?" SmartAsset, 2025. https://smartasset.com/investing/what-does-it-mean-to-be-mass-affluent
- UBS. "Global Wealth Report 2025: Wealth growth accelerated in 2024." UBS, June 2025. https://www.ubs.com/global/en/media/display-page-ndp/en-20250618-gwr-2025.html
- Arts Economics and UBS. "The Art Basel and UBS Survey of Global Collecting 2025." UBS, 2025. https://www.ubs.com/global/en/our-firm/art/art-market-research/ubs-survey-of-global-collecting-2025.html
- Capgemini. "Global millionaire population jumps by nearly 2 million in 2025." Capgemini press release, June 2025. https://www.capgemini.com/news/press-releases/global-millionaire-population-jumps-by-nearly-2-million-in-2025-driven-by-strong-stock-market-performance-worldwide/
- Capgemini. "North America high-net-worth individual population surges, while Europe and Middle East shrink." Capgemini press release, June 2025. https://www.capgemini.com/news/press-releases/north-america-high-net-worth-individual-population-surges-while-europe-and-middle-east-shrink/
- Cresset Capital. "What Is a Multi-Family Office?" Cresset, accessed June 2026. https://cressetcapital.com/family-office/multi-family-office/
- SmartAsset. "Differences Between Mass Affluent and High-Net-Worth Individuals." SmartAsset, 2025. https://smartasset.com/financial-advisor/mass-affluent-vs-high-net-worth
Disclosures
Investing involves risk. Past results are not indicative of future outcomes.
Masterworks is providing this communication as an agent for its issuer entities, not Masterworks Advisers. This material is produced by Masterworks for informational purposes only and does not constitute investment advice, a recommendation, or an offer or solicitation to buy or sell any security. Masterworks is not a licensed broker-dealer by the SEC or FINRA.
Masterworks can only make and accept sales after an offering statement has been filed, and "qualified", by the SEC. Any offers may be revoked before notice of qualification. Indications of interest involve no obligation. For further disclosure visit the offering documents filed with the SEC and Important Disclosures at masterworks.com/cd.
Forward-looking statements and internal estimates are based on assumptions that may prove incorrect, and actual outcomes may differ materially. Figures denoted in brackets are subject to confirmation. Investing in art and alternative assets involves risk, including loss of principal.
Art sales price data is comparative only. Each painting is unique and historical data is not a direct proxy for any specific painting or investment. Data represents whole art, not an investment into our offerings which includes fees and expenses. Any comparative images are not currently live offerings and are provided for educational purposes only.
Masterworks, LLC is located at 1 World Trade Center, 57th Floor, New York, NY 10007.


