
Masterworks Research · June 2026
How private equity and venture capital differ in stage, control, holding period, and the shape of their returns, and where a third illiquid alternative fits.
Private equity and venture capital are both forms of private-market investing, but they sit at opposite ends of a company's life. Private equity (PE) buys controlling stakes in mature, cash-generating businesses and works to improve them over several years before a sale. Venture capital (VC) takes minority stakes in early-stage startups, accepting that most will fail in exchange for a few that may return many times the money. The practical difference for an investor comes down to four things: what you own, how long you wait, how the returns are distributed, and how hard the strategy is to access. We think the cleanest way to choose between them is to understand the shape of the returns each one produces, because that shape, more than the headline averages, is what an allocation actually feels like.
What You Need to Know
- PE buys control of profitable companies; VC buys minority stakes in startups. A buyout fund typically takes a majority position in an established business with steady cash flow. A venture fund takes a small slice of an unproven company and has little operational control. That single difference drives almost everything else.
- The return shapes are different, and the shape matters more than the average. Over the 10 years ended December 2024, the Cambridge Associates US Private Equity Index returned 15.1% and the US Venture Capital Index returned 13.7% on a pooled net basis [1]. The averages look close. The dispersion does not: VC posted a 3-year return of -6.4% over the same window while PE held at 4.4% [1].
- VC runs on a power law. Research from Correlation Ventures found that roughly 65% of venture deals fail to return the capital invested, while fewer than 4% return 10x or more [2]. A handful of winners carry the whole fund.
- Both lock up your capital, and holding periods are getting longer. The median holding period for a US PE-backed company reached about 3.4 years by the end of 2024, the longest in roughly a decade, and longer life-of-fund commitments of 10 years or more are standard in both [3].
- Access is the real constraint for most investors. Traditional closed-end PE and VC funds are sold to institutions and qualified investors with high minimums. There were more than 215,000 PE and VC-backed private companies as of late 2024, against roughly 8,800 public companies, yet most individuals cannot buy into the funds that hold them [4].
1. Private equity vs venture capital: what you actually own
The first difference between private equity and venture capital is the company itself. PE invests in mature businesses that already generate revenue and, usually, profit. The fund buys a controlling stake, often the whole company, frequently using debt to do it, then spends several years improving operations, margins, or strategy before selling to another buyer or the public markets. The classic form is the leveraged buyout.
VC invests at the other end of the life cycle. A venture fund writes a check into a young company that may have a product and little else, takes a minority stake, and bets on growth. It does not control the company. It holds a board seat or two, advises, and waits to see whether the business reaches an exit, an acquisition or an initial public offering, or fails.
That contrast in ownership sets up everything that follows. A control investor in a cash-flowing business can pull operational levers and use leverage to amplify returns. A minority investor in a startup is along for the ride, which is why venture outcomes are so widely spread.
2. Stage, risk, and why VC accepts more failure
PE and VC sit at different points on the risk spectrum because they invest at different points in a company's maturity. A buyout target has a track record, customers, and cash flow, so the central question is execution: can the new owner make a sound business better. A venture target may have none of those things, so the question is existential: will the company survive and scale at all.
The data reflects it. In venture, most individual investments lose money. The Correlation Ventures analysis of roughly 21,000 financings found about 65% returned less than the capital invested [2]. Marc Andreessen has described a related pattern at the fund level, where a small number of deals generate the overwhelming majority of returns, on the order of a few percent of the portfolio producing most of the gains [5].
PE failure rates are lower because the underlying companies are more stable, though leverage adds its own risk. When a buyout uses significant debt and the business stumbles, the losses can be severe. The risk is real in both. It just takes a different form.
3. Return distribution: power law vs control and cash flow
This is the difference we think matters most, and it is the one headline averages hide.
VC returns follow a power law. A few investments return enormous multiples and carry the entire fund, while the majority return little or nothing. The implication is uncomfortable for anyone holding a single fund or a concentrated set of deals: miss the winners and you may underperform a simple index. One often-cited finding is that an index of the whole early-stage venture universe would outperform roughly three-quarters of individual venture funds, because so many funds never catch a top outcome [5].
PE returns are shaped by control and cash flow, so they cluster more tightly. A buyout fund holding ten profitable companies and improving each one produces a band of outcomes rather than a lottery. You can see the difference in the volatility, not just the average.
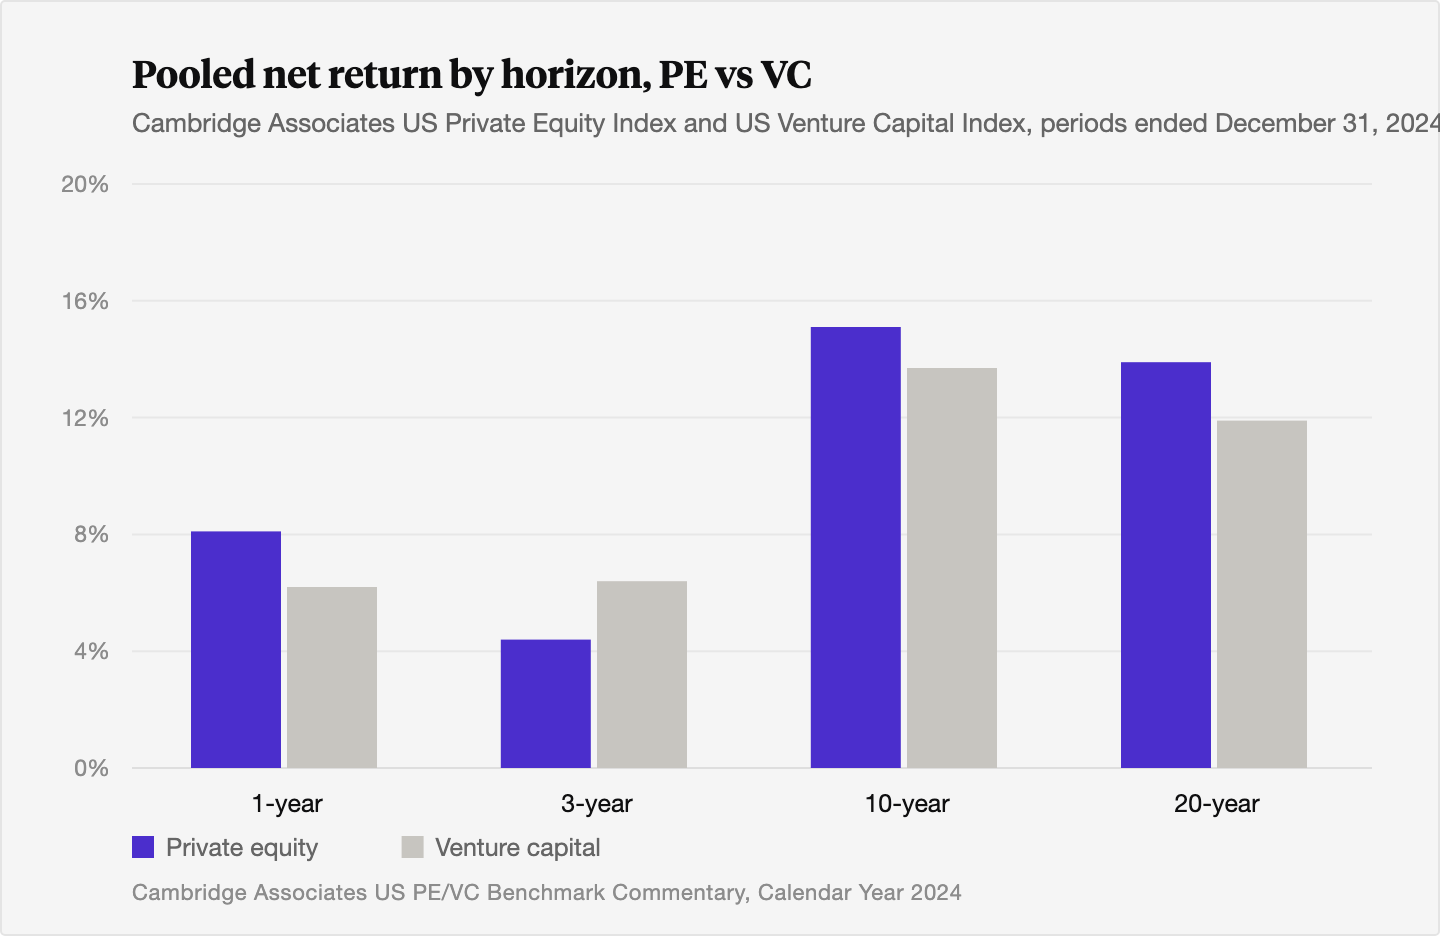
Over a long horizon the two indices land close together, 15.1% versus 13.7% over ten years. Over three years they split sharply, with VC at -6.4% after its 2022 and 2023 drawdowns and PE at 4.4% [1]. Past performance is not predictive of future results, and these are pooled indices that smooth over wide manager-level dispersion. The point is the dispersion itself. VC asks you to tolerate years of negative readings for the chance at the outliers. PE asks you to accept a steadier, more bounded path.
4. Holding period and liquidity
Neither strategy is liquid, and the lockups have been getting longer. Most PE and VC funds run for ten years or more, with capital called over time and returned only as the fund exits its investments.
Inside that structure, holding periods at the company level have stretched. The median holding period for a US PE-backed company reached about 3.4 years by the end of 2024, the longest in roughly nine years, as a slower exit environment kept companies in portfolios longer [3]. Other measures that weight by company age put the figure higher, but the direction is the same across sources [3]. VC holds tend to run longer still, since a startup often needs years to reach an exit, and many never do.
For an investor, the takeaway is plain. Money committed to either strategy should be money you will not need for the better part of a decade. The illiquidity is the price of admission, and it is part of why these assets can behave differently from public markets.
5. Ownership, control, and fund structure
PE and VC use a similar wrapper, the closed-end limited partnership, but they wield it differently. In both, a general partner (GP) runs the fund and limited partners (LPs) supply the capital. The GP typically charges a management fee, often around 2% of committed capital, and takes a share of profits, the carried interest, commonly 20% above a hurdle. Carried interest is how fund managers are paid for performance, and it sharpens the GP's focus on the few outcomes that move the fund.
The difference is what the GP does with control. A PE GP holds the keys to the company and can replace management, add leverage, or reshape the business. A VC GP holds a minority stake and influences through advice and board votes rather than command. That is why PE returns can be engineered to a degree, while VC returns depend more on backing the right founders and getting out of the way.
6. Access: the constraint most investors hit first
The market is enormous and mostly out of reach. Private equity and venture capital backed more than 215,000 companies as of late 2024, against roughly 8,800 public companies, and combined PE and VC assets under management were just over $11 trillion at year-end 2023 by one measure [4]. By a broader measure that counts separately managed accounts and co-investments, McKinsey put alternative-capital PE AUM at roughly $8.5 trillion entering 2025 [6].
Yet the funds that hold these companies are sold mainly to institutions and qualified or accredited investors, with minimums that start in the hundreds of thousands and often run higher. For most people, the practical question is not which strategy to pick. It is whether they can get into either at all. This access gap is one reason demand for structures that lower the barrier to private assets has grown, a theme that runs across alternatives, including art.
7. Where art fits as a third illiquid alternative
Private equity and venture capital are not the only illiquid alternatives an investor can use to diversify away from public stocks and bonds. Fine art is a third, and it behaves differently from both, which is the point of holding it.
Start with the return shape, since that was the through-line of this piece. VC runs on a power law and PE on control and cash flow. Art runs on scarcity. Supply of blue-chip work tends to shrink over long periods as pieces enter museum collections and leave the market, which is a different engine from a startup's growth curve or a buyout's margin expansion. Contemporary art delivered an annualized return of about 13.6% between 1995 and 2022 by one widely cited estimate [7], a figure in the same neighborhood as the long-run PE and VC index returns above, though produced by an unrelated mechanism. Past performance is not predictive of future results, and art returns carry their own caveats, including survivorship bias in the indices and the unique, non-fungible nature of each work.
Correlation is where art earns its place. Art has historically shown low correlation to traditional financial markets, which is what makes it useful in a portfolio alongside, rather than as a substitute for, PE and VC [7]. Wealth holders have noticed. The Deloitte and ArtTactic Art and Finance Report 2025 found that family offices reported an average allocation of 13.4% to art and collectibles, and that 51% of wealth managers now offer art-related services, up from about a quarter in 2011 [7].
Access has been the same wall for art as for private funds. A serious collection has historically required millions and the relationships to source it, which is why most investors never participated. We built Masterworks to lower that barrier the way the broader alternatives market has tried to lower it for private equity and venture capital, by turning a large, illiquid asset into something more investors can hold a piece of. This is general education, not a recommendation, and art, like PE and VC, is a long-term illiquid allocation that can lose value.
The Bottom Line
- Private equity buys control of mature, profitable companies; venture capital takes minority stakes in early-stage startups, and that ownership difference drives the rest.
- Over ten years the Cambridge Associates PE and VC indices returned 15.1% and 13.7% on a pooled net basis, but VC's path is far more volatile, with a -6.4% three-year reading against PE's 4.4%.
- Venture returns follow a power law, where roughly 65% of deals lose money and a small set of winners carry the fund; PE returns cluster more tightly around control and cash flow.
- Both are illiquid, with fund lives of ten years or more and company holding periods that have stretched to multi-year highs.
- Access through traditional funds is limited to institutions and qualified investors, which is the first constraint most individuals encounter.
- Fine art is a third illiquid alternative with a scarcity-driven return engine and low correlation to financial markets, useful alongside PE and VC rather than as a replacement for either.
Sources
- Cambridge Associates. "US PE/VC Benchmark Commentary: Calendar Year 2024." Cambridge Associates, July 22, 2025. https://www.cambridgeassociates.com/wp-content/uploads/2025/07/2025-07-US-PE-VC-Benchmark-Commentary-CY-2024-PUBLIC.pdf
- VC Beast. "The Venture Capital Power Law Explained: Why Most Returns Come From a Few Deals." VC Beast, 2025. https://vcbeast.com/venture-capital-power-law-explained
- S&P Global Market Intelligence. "Private equity buyouts record longer holding periods in 2025." S&P Global, December 2025. https://www.spglobal.com/market-intelligence/en/news-insights/articles/2025/12/private-equity-buyouts-record-longer-holding-periods-in-2025-96348743
- HarbourVest Partners. "How Does the Size of Private Markets Compare to Public Markets?" HarbourVest, 2024. https://www.harbourvest.com/insights-news/insights/cpm-how-does-the-size-of-private-markets-compare-to-public-markets/
- BIP Ventures. "Explainer: What is the Venture Capital Power Law." BIP Ventures, 2025. https://www.bipventures.vc/news/explainer-what-is-the-venture-capital-power-law
- McKinsey & Company. "Global Private Markets Report 2025: Braced for shifting weather." McKinsey & Company, February 2025. https://www.mckinsey.com/industries/private-capital/our-insights/global-private-markets-report-2025
- Deloitte and ArtTactic. "Art & Finance Report 2025." Deloitte Private and ArtTactic, 2025. https://www.deloitte.com/lu/en/services/consulting-financial/research/art-finance-report.html
- Cambridge Associates. "US PE/VC Benchmark Commentary: First Half 2025." Cambridge Associates, 2025. https://www.cambridgeassociates.com/insight/us-pe-vc-benchmark-commentary-first-half-2025/
- PitchBook. "Aging buyout portfolios reach decade high at 3.4-year hold period." PitchBook, 2025. https://pitchbook.com/news/articles/aging-buyout-portfolios-reach-decade-high
- Preqin. "2025 Global Report: Private Equity." Preqin, 2025. https://www.preqin.com/insights/global-reports/2025-private-equity
- Art Basel and UBS. "The Art Basel and UBS Global Art Market Report 2026," authored by Dr. Clare McAndrew, Arts Economics. Art Basel and UBS, March 2026. https://www.artbasel.com/stories/the-art-basel-and-ubs-global-art-market-report-2026
- Adams Street Partners. "2025 Global Investor Survey: Navigating Private Markets." Adams Street Partners, 2025. https://www.adamsstreetpartners.com/insights/2025-global-investor-survey/
For related reading, see our explainers on what private equity is and how to invest, how venture capital and VC returns work, art vs venture capital risk and return profiles for high-net-worth investors, and art as an alternative allocation, a framework for advisors.
Disclosures
Investing involves risk. Past results are not indicative of future outcomes.
Masterworks is providing this communication as an agent for its issuer entities, not Masterworks Advisers. This material is produced by Masterworks for informational purposes only and does not constitute investment advice, a recommendation, or an offer or solicitation to buy or sell any security. Masterworks is not a licensed broker-dealer by the SEC or FINRA.
Masterworks can only make and accept sales after an offering statement has been filed, and "qualified", by the SEC. Any offers may be revoked before notice of qualification. Indications of interest involve no obligation. For further disclosure visit the offering documents filed with the SEC and Important Disclosures at masterworks.com/cd.
Forward-looking statements and internal estimates are based on assumptions that may prove incorrect, and actual outcomes may differ materially. Figures denoted in brackets are subject to confirmation. Investing in art and alternative assets involves risk, including loss of principal.
Art sales price data is comparative only. Each painting is unique and historical data is not a direct proxy for any specific painting or investment. Data represents whole art, not an investment into our offerings which includes fees and expenses. Any comparative images are not currently live offerings and are provided for educational purposes only.
Masterworks, LLC is located at 1 World Trade Center, 57th Floor, New York, NY 10007.


